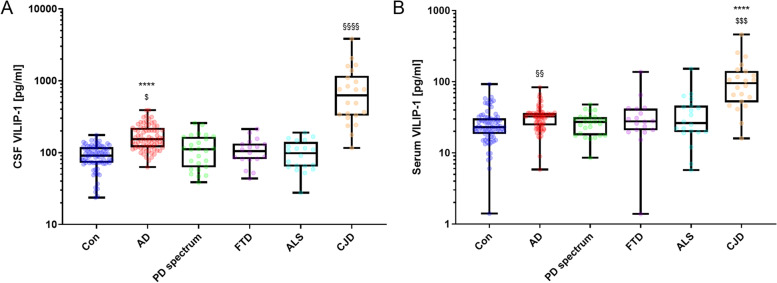
Fig. 1.
CSF and serum VILIP-1 results in the diagnostic groups. A CSF VILIP-1 levels in the diagnostic groups. ****, p<0.0001 vs. Con. §§§§, p<0.0001 vs. Con, PD spectrum, bvFTD, and ALS. $, p=0.0006 vs. ALS, p=0.0053 vs. PD spectrum, p=0.017 vs. bvFTD, and p=0.0026 vs. CJD. B Serum VILIP-1 levels in the diagnostic groups. For §§, p=0.0055 vs. Con. ****, p<0.0001 vs. Con, AD, and PD spectrum. $$$, p=0.0005 vs. bvFTD, p=0.0004 vs. ALS. For CSF and serum analysis: Con: n=75, AD: n=73, PD spectrum: n=26, bvFTD: n=18, ALS: n=20, CJD: n=22. Concentrations are displayed as box plots with single patients shown. Illustrated are the median concentration, the 25% and 75% percentile, and whiskers from minimum to maximum. Groups were compared by the Kruskal-Wallis test and Dunn’s post hoc test. AD, Alzheimer’s disease; ALS, amyotrophic lateral sclerosis; CJD, Creutzfeldt-Jakob disease; Con, non-neurodegenerative controls; bvFTD, behavioral variant frontotemporal dementia; PD, Parkinson’s disease

