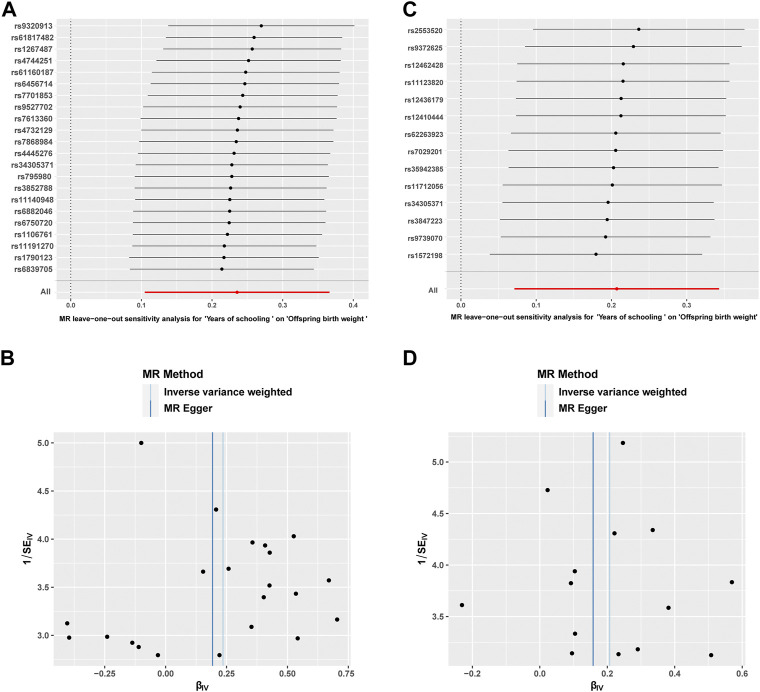
FIGURE 4.
Sensitivity analysis results of leave-one-out plots and funnel plots. The leave-one-out plot (A) showing the causal effect of female educational attainment on offspring birth weight after eliminating SNPs one by one. The funnel plot (B) displayed the overall symmetry of the causal effects of all instrumental variables. Likewise, sensitivity analysis results of the leave-one-out plot (C) and funnel plot (D) presented the male educational attainment-offspring birth weight relationship.

