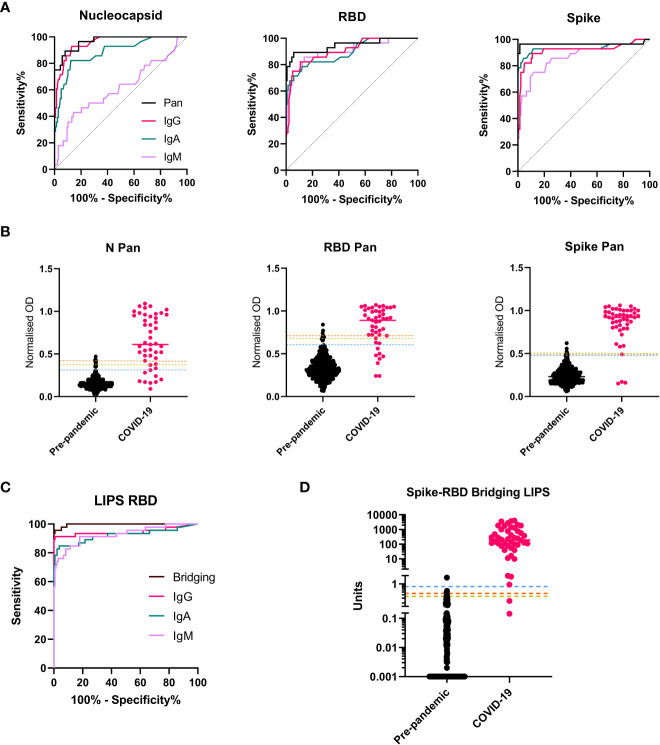
Figure 2.
Selection of screening assays and threshold setting with the threshold set. A subset of the threshold set samples were used for assay optimization and then to compare performance of isotype/total antibody specific assays for each antigen/platform combination. (A) ROC curves showing the relative performance of ELISAs using different secondary antibodies (Pan total antibody (Black); IgG (pink); IgA (green), IgM (purple) in a cohort of n = 27 COVID-19 samples and n = 133 pre-pandemic samples from the threshold set. For all three antigens, the Pan/total antibody assays provided the best performance as evidenced by highest AUCs. (B) Scatterplots showing the individual normalized OD readings for all three ELISA screening assays (N Pan, RBD Pan and Spike Pan) in the full threshold set of n = 45 COVID-19 samples and n = 399 pre-pandemic), with the median represented by a line for each group and the three thresholds for each assay indicated with a line across the plot: 1 – the 99th percentile of pre-pandemic levels (orange dashed line); 2 - The 98th percentile (yellow dashed line); 3 – Youden’s index (blue dashed line). (C) ROC curves for all LIPS assays deployed on a subset of the threshold set (n = 46 COVID-19 cases and n = 134 pre-pandemic) showing optimal performance with the Spike-RBD Bridging LIPS assay, which was therefore taking forward for full threshold setting on the full threshold set (n = 446) with results shown in the scatterplot in (D). (Interpolated unit values shown on y axis with log10 scale and broken axis to allow visualization of thresholds. To ensure all results were plotted, a result of zero units was assigned a value of 0.001 for this graph. The three thresholds are indicated: 1 – the 99th percentile of pre-pandemic levels (orange dashed line); 2 - The 98th percentile (yellow dashed line); 3 – Youden’s index (blue dashed line).

