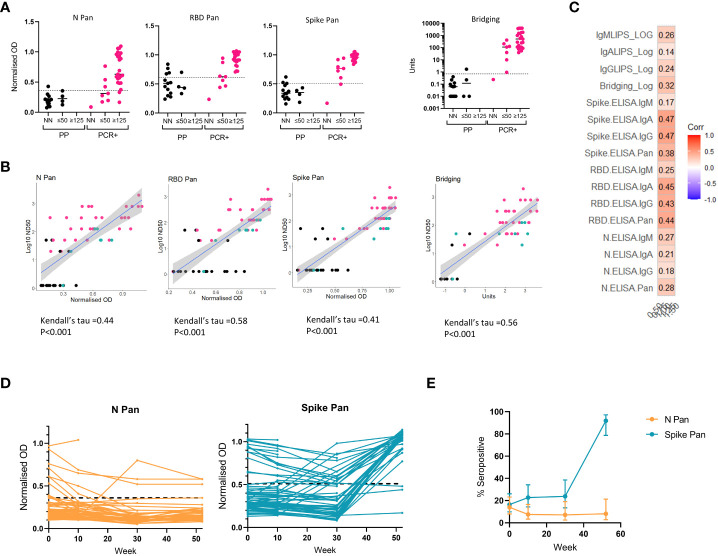
Figure 5.
Relationship between binding antibody results and neutralization titers and application of screening assay to longitudinal cohort. On a subset of the samples from the threshold and validation sets, we compared screening assay results to neutralizing antibody titers were measured using a microneutralization assay using SARS-CoV-2 and a pseudotype viral neutralization assay using vesicular stomatitis virus (VSV) expressing Spike (A-C). (A) A microneutralization assay was performed on 17 pre-pandemic serum samples and 31 from RT-PCR confirmed cases, and stratified the results into 3 groups: non neutralizing (ND); ND50 of 20 or 50 (≤50); ND50 of 125 or above (≥125) and compared these groupings to the screening assay results: N Pan ELISA; RBD Pan ELISA; Spike Pan ELISA; Spike-RBD Bridging LIPS assay (where readouts are normalised OD or Units). (B) The relationship between results from each screening assay results and ND50 measured using the microneutralization assay in n = 59 samples displayed in scatterplots from a mixture of pre-pandemic (black), PCR-confirmed COVID-19 cases (pink) and exposed individuals or recent COVID-19 suspects (green). with a line showing the smoothed mean determined using a generalized linear model +/- 95% confidence intervals; and correlation performed using Kendall’s tau. (C) Correlogram showing the relationship between a novel pseudotype viral neutralization assay (using mouse VSV expressing SARS-CoV-2 Spike and ACE-2 and TMPRSS-2) and all 16 ELISA and LIPS assays (total antibody and isotype specific) in n = 36 samples with neutralising capacity. (D) Field testing two screening assays (N Pan and Spike Pan ELISA) on longitudinal samples from a cohort of n = 79 healthcare workers in Bristol in 2020 and 2021. (E) Observed seroprevalence/antibody positivity to N and Spike proteins using Pan ELISA assays in a cohort of n = 79 healthcare workers. Total samples collected at each timepoint were as follows: week 0, n=79; week 10, n=66; week 30, n = 42; week 52, n = 37. 95% confidence intervals were calculated using the Wilson method.

