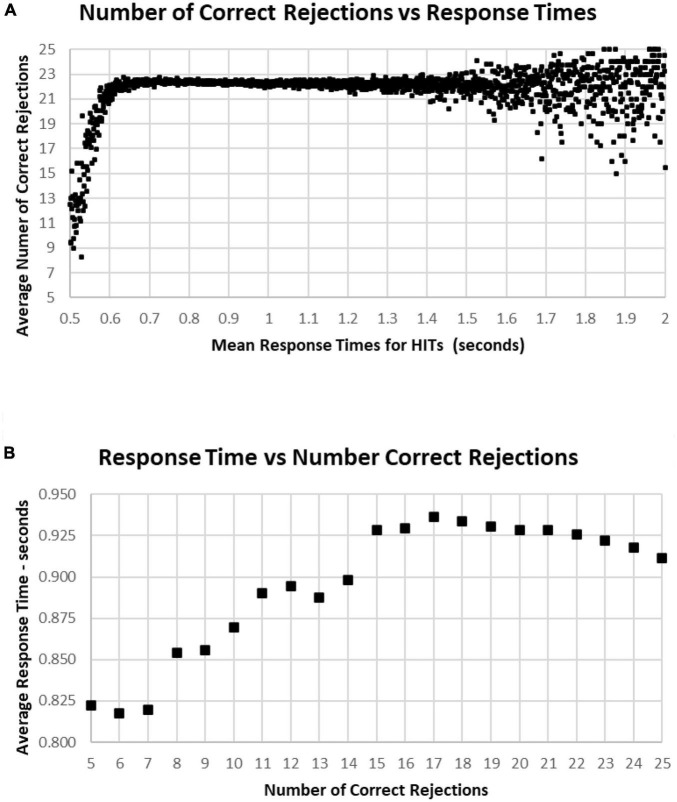
FIGURE 12.
(A) Average number of Correct Rejections for each RT, showing the Correct Rejection of component of correct responses. Note that that over an RT of 0.650 s, there is essentially no relationship of Correct Rejections and RT, with about 22 Correct Rejections occurring on the average. By contrast, for faster RTs, there is a steep speed/accuracy trade-off between speed and accuracy of Correct Rejections. Again, the small number of tests above 1.4 s show the dispersion with fewer tests, but there is no indication of a different slope. (B) Again, same data as (A), showing an RT of 0.911 s for 25 Correct Rejections and a slight increase of RT down to 15 Correct Rejection, but there are faster RTs with lower numbers of Correct Rejections, which reflects the alteration of strategy (less inhibition) associated with this aspect of poor performance on the MemTrax test.

