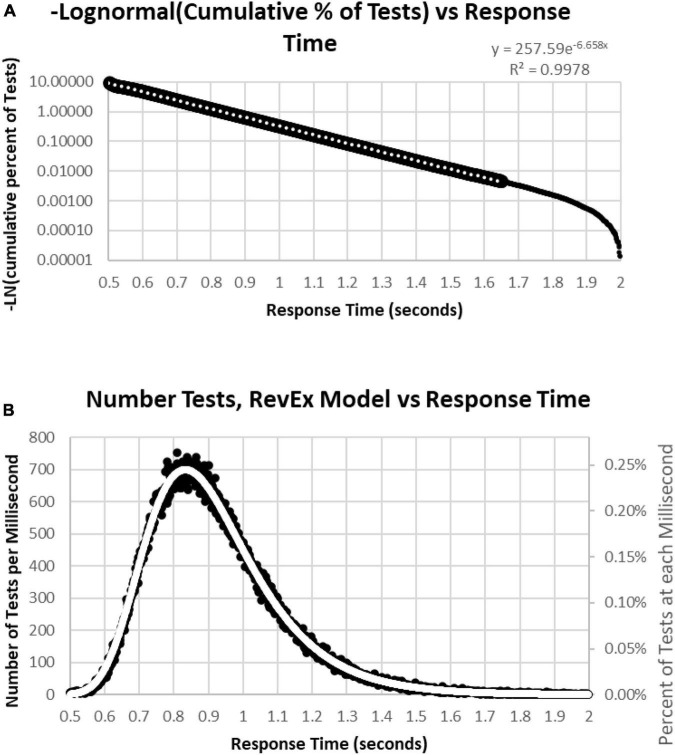
FIGURE 8.
(A) Negative natural logarithm of the cumulative percentage of RTs plotted against the RT. The Pearson regression exponential curve explained nearly all the variance between 0.5 and 1.65 s. (B) Calculation of exponential curve back to number of RTs. The curve clearly fits the distribution of the RTs. The most responses were at 0.810 s followed by 0.839 and 0.864 s, while the peak of the RevEx model was at 0.833 s.

