
Figure 2.
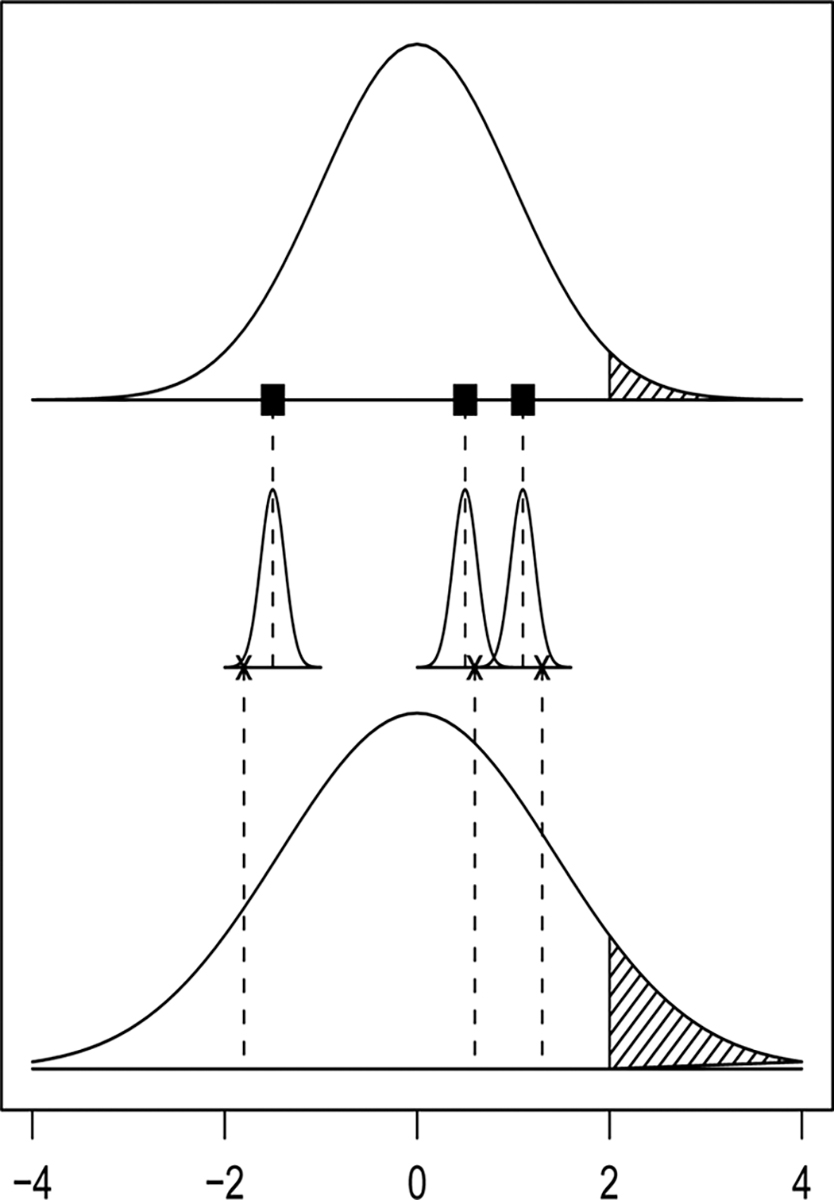
Illustration of the sources of variability in the averaged permutation distribution for the difference in means statistic. The top panel shows the approximate Gaussian (0, τ2) distribution of the , i.e., exhaustive WCR permutation distribution. Conditional on , has an approximate Gaussian distribution. Thus unconditionally, the Monte Carlo WCR permutation distribution (bottom panel) is more spread out than the exhaustive permutation distribution. The shaded area of the bottom panel is larger than for the top panel, illustrating that the Monte Carlo p value is likely to be larger than the exhaustive p value.