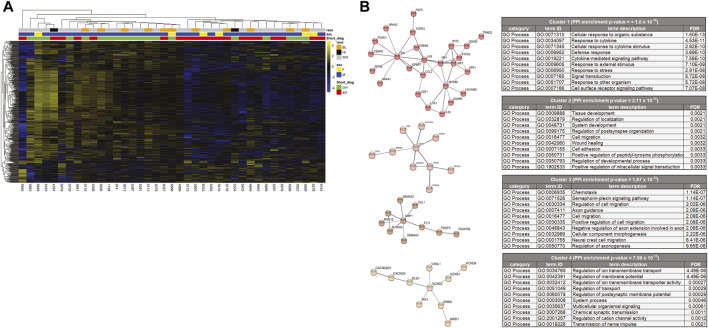
FIGURE 2.
(A) Heat map of differentially expressed genes. Of the total 427 differently expressed genes, 360 were down-regulated and 67 were up-regulated in ASD cases. Both the genes (rows) and cases (columns) were clustered using dendrograms constructed using Euclidean distances and hierarchical clustering and grouped by case demographics. (B) STRINGdb analysis of the differentially expressed genes that were decreased in the cases compared to the controls. The network was divided into clusters using the MCL inflation parameter and the top 4 clusters were analyzed for enrichment of Gene Ontology processes and the top 10 processes for each cluster are represented.

