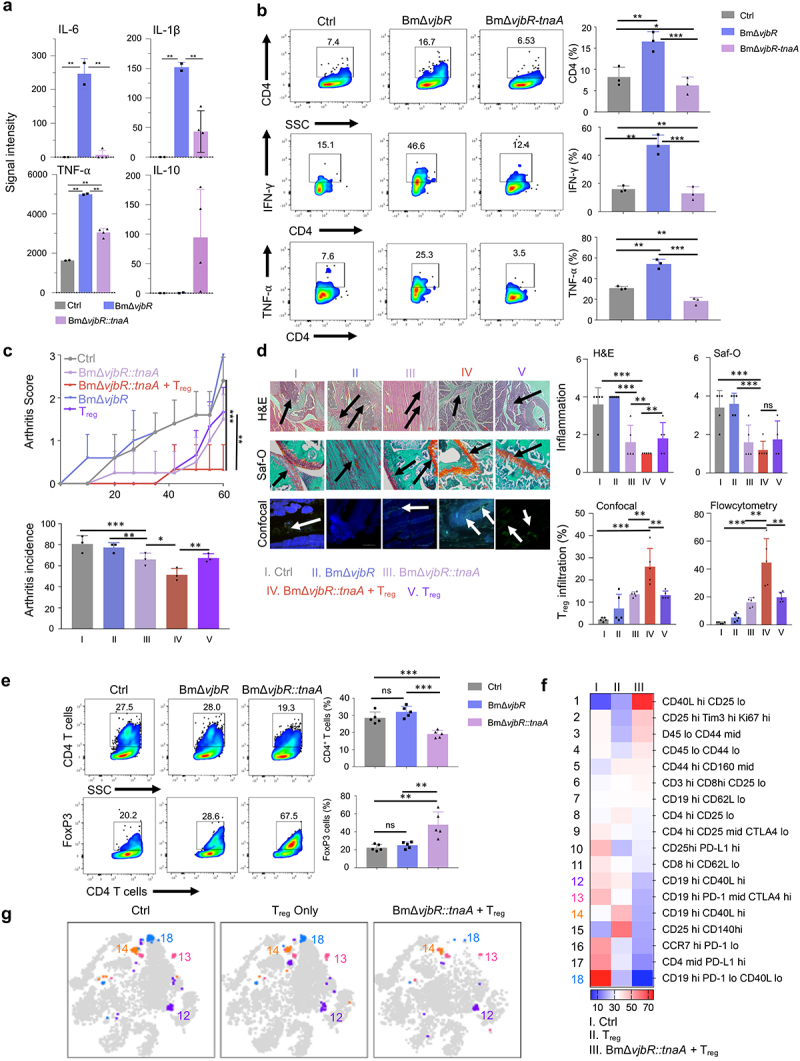
Figure 3.

BmΔvjbR::tnaA significantly dampens inflammation and reduces arthritis in murine CIA model which is augmented by adoptive cell transfer (ACT) of Treg cells. a, Cytokine arrays were used to measure pro-inflammatory cytokines produced by control, BmΔvjbR, and BmΔvjbR::tnaA treated BMDMs. b, Flow cytometric analysis of IFN-γ and TNF-α of T cells co-cultured with BMDMs. BMDMs were treated with either BmΔvjbR::tnaA or BmΔvjbR and then co-cultured with CD4+ T cells derived from pooled LNs and spleen of C57BL/6 mice for the assay. c, Arthritis score and arthritis incidence in CIA C57BL/6 mice from control (Ctrl, gray bar); BmΔvjbR (blue bar); BmΔvjbR::tnaA (pink bar); BmΔvjbR::tnaA followed by ACT of Treg cells (Treg, red bar) and ACT of Treg cells only; (N=5 in each group). d, Representative images of H&E, Saf-O staining, and confocal microscopy from mouse knees on day 60 post CIA induction. Arrows indicate areas of infiltration of immune cells (H&E), cartilage-integrity (Saf-O) and Treg cell infiltration (confocal microscopy). Intracellular FoxP3 staining (green) was used to denote Treg cells. Quantitative analysis of Treg cell infiltration and inflammation scores from these mice are also shown. e, Cells from knee and ankle joints were collected from CIA-induced mouse groups (Ctrl, BmΔvjbR, and BmΔvjbR::tnaA combined with ACT of Treg cells). These cells were then stained and quantified by flow cytometry using markers for CD4+ T cells (upper panel) and intracellular staining of FoxP3 (Treg cells) (lower panel). f, CIA-induced mice were treated with PBS (Ctrl), ACT of Treg cells only (Treg cells only; N=5), or BmΔvjbR::tnaA combined with ACT of Treg cells (N=5). Cells from the spleen, LNs and joints were stained with 21 markers and measured by CyTEK aurora flow cytometry. Heatmap shows immune cell profiles in different treatment groups of mice (scale bar represents percentage of cell in each treatment group within each cell type). g, viSNE map shows the four subtypes of B cells differentially expressed in the treated group of mice. Data represent means ± SD. Student’s t-test or Tukey's multiple comparisons test was applied for statistical analysis. *, **, ***: significance at p < 0.05, 0.01, 0.001.
