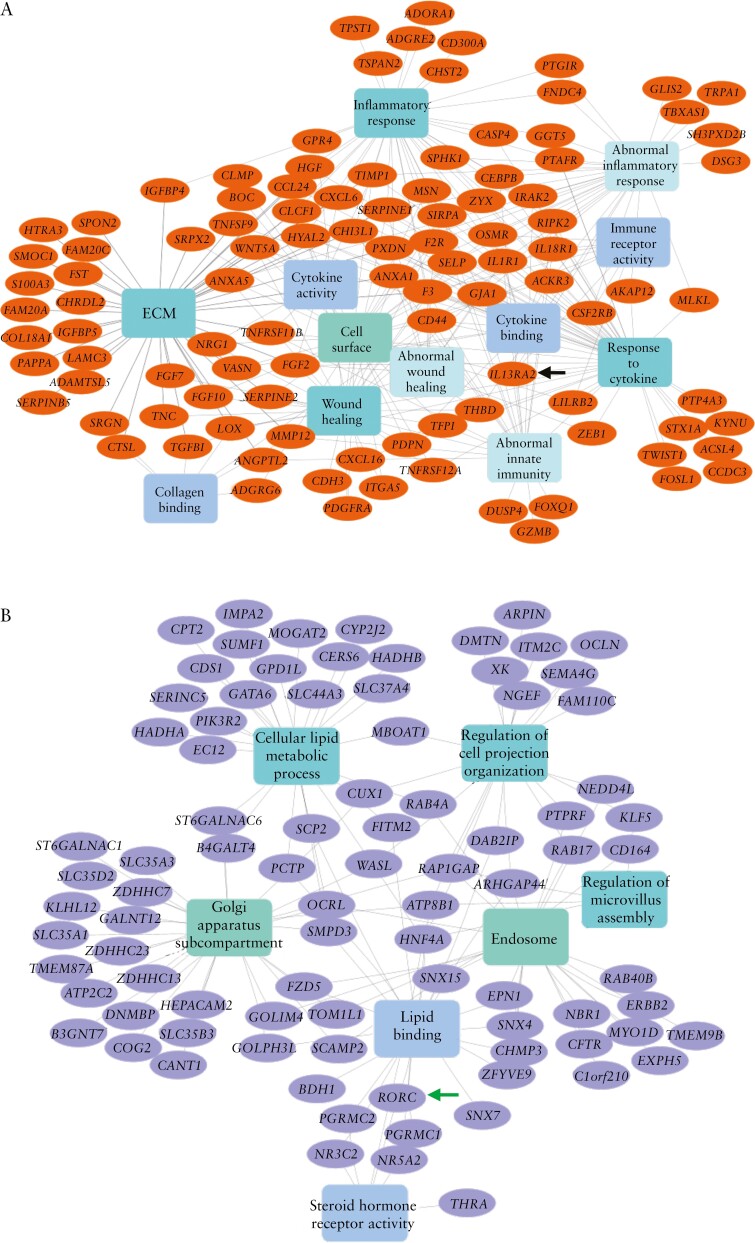
Figure 4.
Network representation of significantly enriched terms [rectangles] of IL13RA2 and RORC top-correlated genes [ovals] from the black and brown modules, respectively. [A] Black module containing IL13RA2, indicated by the black arrow. [B] Brown module containing RORC, indicated by the green arrow.

