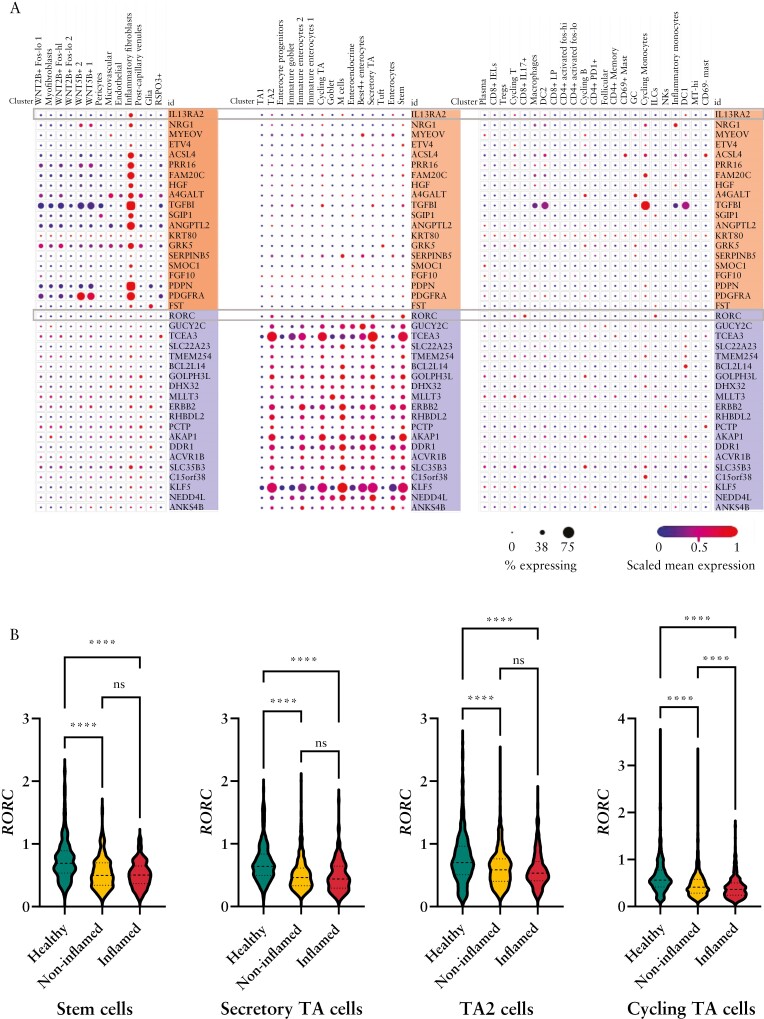
Figure 5.
Cell-specific expression of IL13RA2 and RORC and their most closely correlated genes. [A] Expression of IL13RA2 and its 20 most closely correlated genes within the black module [shaded in orange] and RORC and its 20 most closely correlated genes from the brown module [shaded in purple] within stromal, epithelial and immune cell types from existing adult colon UC single-cell RNA-seq data.16 The size and colour of the dots are proportional to the percentage expressing the gene and the normalized expression level, respectively. [B] Further analysis of the same adult single-cell RNA-seq data set comparing RORC expression within non-zero expressing cells between healthy, non-inflamed UC, and inflamed UC from specific epithelial cell types. The y-axis units for RORC expression are log2[TP10K + 1]. NS, not significant; ****p < 0.0001. TA, transit amplifying.

