Figure 6.
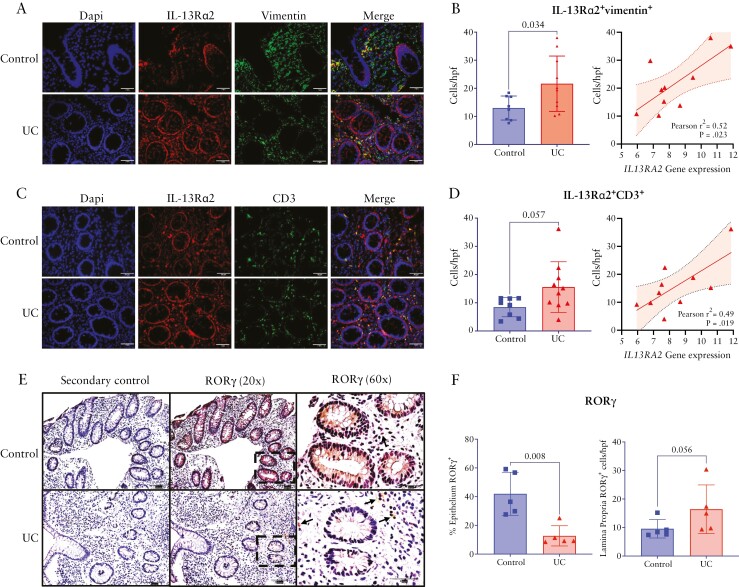
IL-13Rα2 and RORγ protein localization in paediatric UC tissues. Representative immunofluorescence images showing IL-13Rα2 co-localization with vimentin [A] and CD3 [C]; 40× magnification [scale bars = 50 μm]. Comparison of the number of IL-13Rα2+vimentin+ [B] or IL-13Rα2+CD3+ cells [D] per high-power field between UC and non-IBD control patients and correlation with IL13RA2 gene expression within UC tissues. Representative images of immunohistochemical staining for RORγ protein expression [brown] in UC and non-IBD control tissues at 20× [scale bars = 100 μm] and 60× magnification [scale bars = 50 μm]. Images from staining with secondary antibody are displayed as a negative control. Location of the 60× high-power image is indicated by the dashed bordered box overlying the 20× magnification image. Arrows indicate RORγ+ lamina propria cells. Comparison of the percentage of the epithelium positively stained for RORγ and the number of RORγ+ lamina propria cells/hpf between non-IBD control and UC tissues [F]. hpf, high power field; UC, ulcerative colitis.

