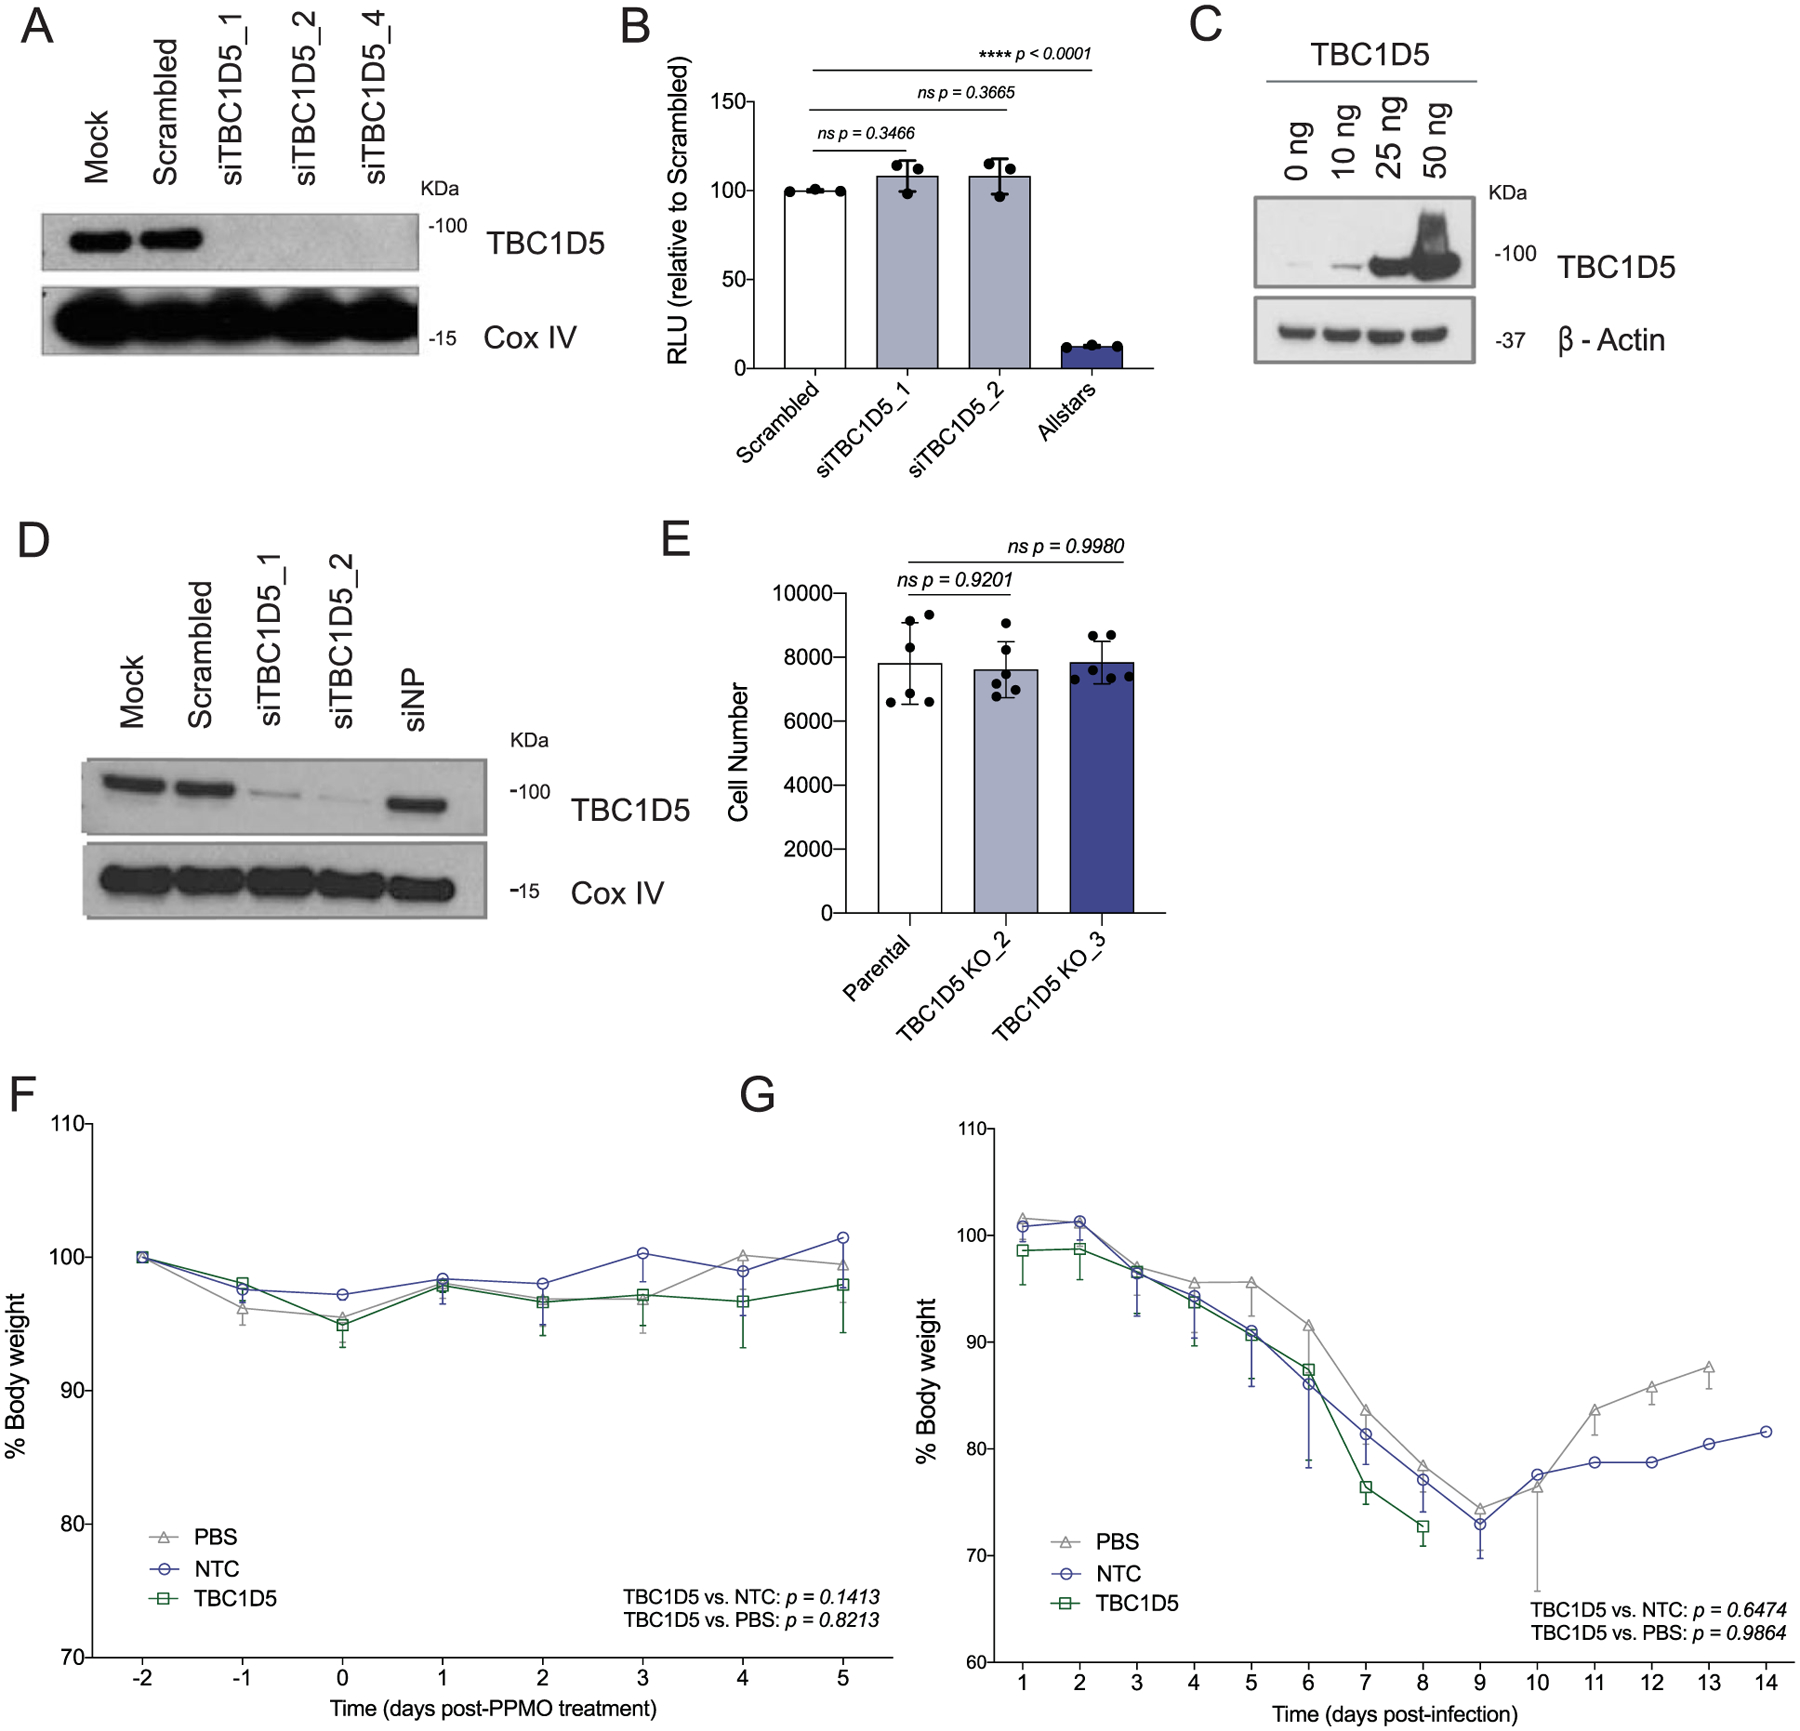
Extended Data Fig. 4 |. TBC1D5 restricts IAV replication and growth in vitro, ex vivo and in vivo.

A549 cells were transfected with indicated siRNAs. At 48 h post-transfection, cells were (a) subjected to SDS–PAGE and immunoblotted using antibodies specific for TBC1D5 and β-actin (loading control). Blot is representative of two independent experiments, or (b) Cell viability was assessed using Cell Titer Glo and compared to scrambled (non-targeting, negative control) and Allstars (toxic siRNA, positive control). Data show mean ± SD from one representative experiment in triplicate (n = 3) of at least two independent experiments. (c) A549 cells were transfected with a plasmid encoding TBC1D5 (0–50 ng) for 36 h. Cells were then subjected to SDS–PAGE and immunoblotted using antibodies specific for TBC1D5 and β-actin. Blot is representative of two independent experiments. (d) HTBE cells were transfected for 36 h with indicated siRNAs. At 48 h post-transfection, cell lysates were subjected to SDS–PAGE and immunoblotted using antibodies specific for TBC1D5 and Cox IV (loading control). Blot is representative of two independent experiments. (e) A549 parental and two TBC1D5 KO clones cell numbers were determined 48 h post-seeding using image-based analysis of DAPI (nuclei) staining. Data show mean ± SD from one representative experiment in triplicate (n = 3) of at least two independent experiments. Five-week old female BALB/c mice were administered 100 μg PBS, NTC or TBC1D5 PPMOs (equivalent of 5 mg/kg) intranasally for 2 consecutive days and (f) Mice were monitored over the course of 5 days in the absence of IAV infection to evaluate PPMO-derived cytotoxicity. Data represent percent body weight ± SD from 2 independent experiments each with 3 mice per condition (n = 6). (g) Mice were infected with A/Puerto Rico/8/34 (40 p.f.u.) intranasally and were monitored for body weight over the course of 14 days. Graphs show percent body weight ± SD from 2 independent experiments each with 15 mice per condition (n = 30). (b, e) Statistical significance was calculated using one-way ANOVA with Dunnett’s post hoc test, or Tukey’s multiple comparison post hoc (f, g).
