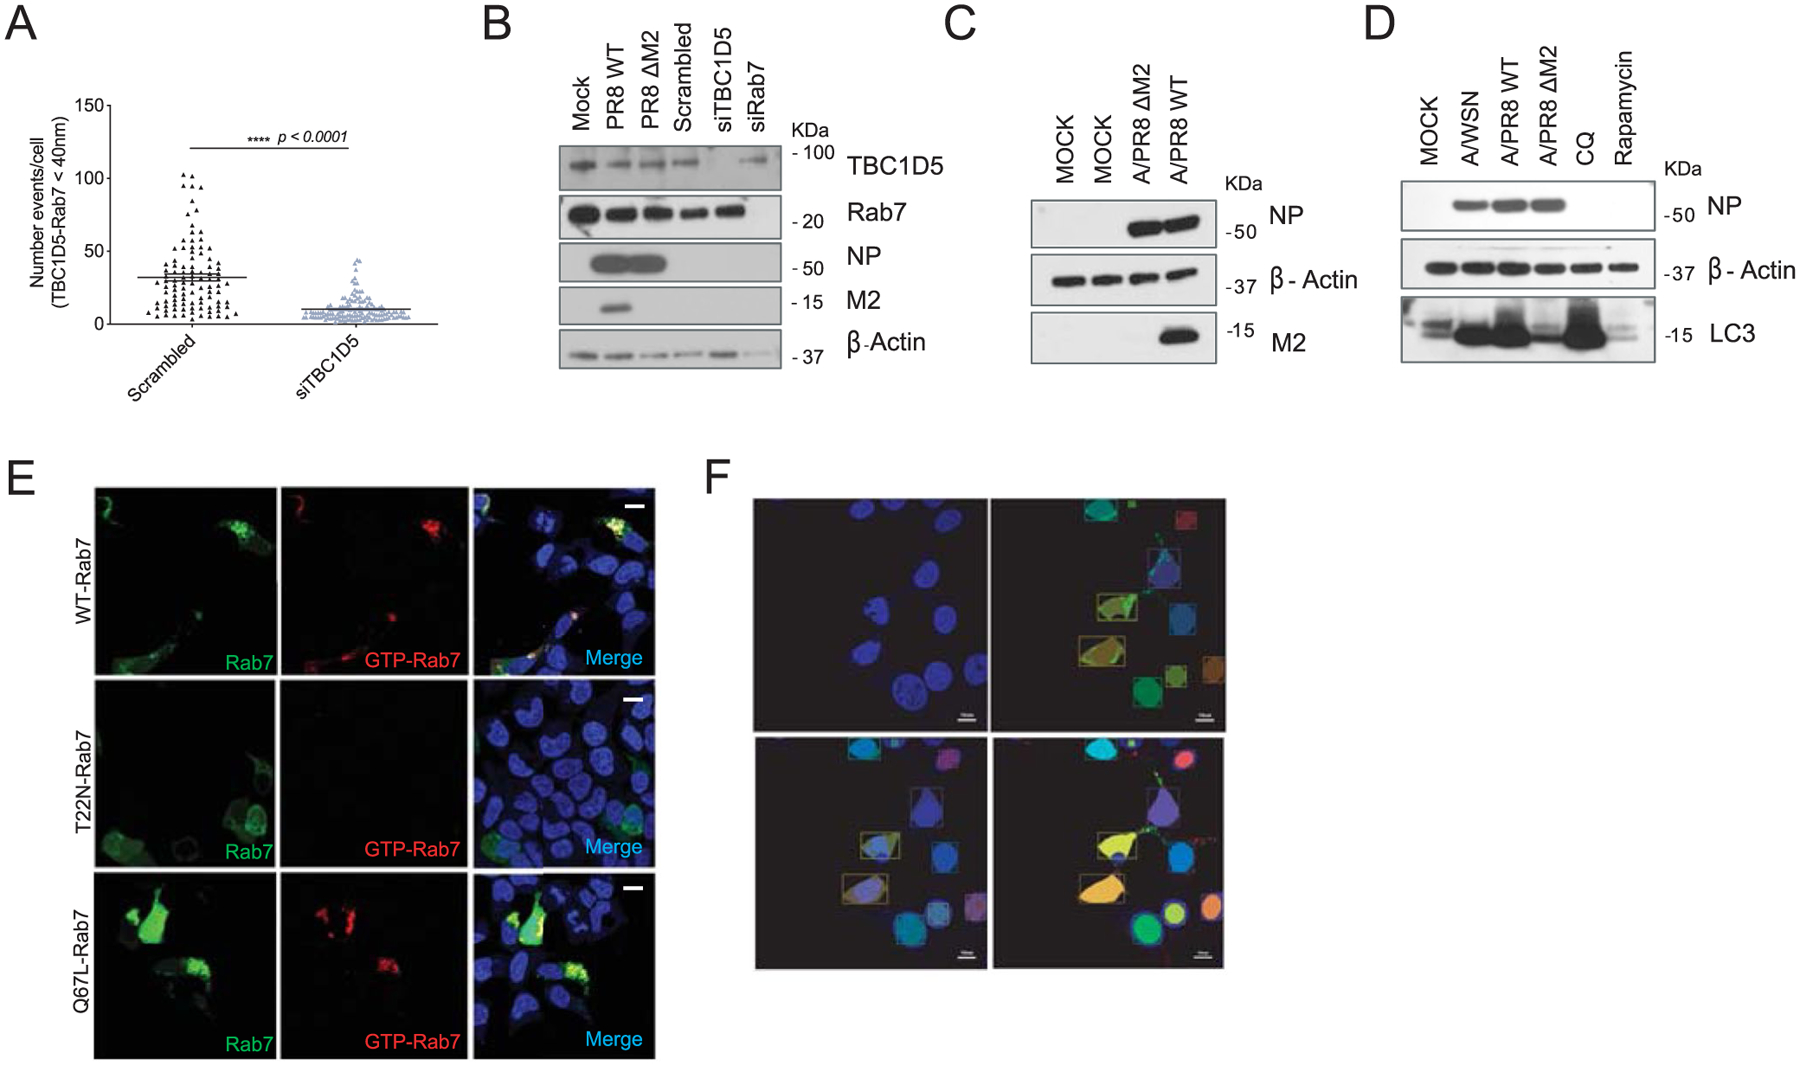
Extended Data Fig. 7 |. IAV M2 protein abrogates TBC1D5 and Rab7 interaction.

(a) 293 T cells were transfected with scrambled or TBC1D5 siRNAs. At 48 h post-transfection, cells were subjected to proximity ligand assays (PLA) staining. Quantification of number of PLA signal events where TBC1D5 proteins interact with Rab7. Data show mean ± s.d. from one representative experiment of at least two independent experiments where at least 50 cells per condition (n = 50) were quantified. Statistical significance was calculated using unpaired two-tailed Student’s t-test. (b) In parallel to PLA experiments (Fig. 6d,e) 293 T cells were subjected to transfection with indicated siRNAs for 48 h, or infected with A/PR8 WT or A/PR8 ΔM2 (MOI 3) for 18 h. Cells were then lysed and levels of TBC1D5, Rab7, NP, M2 and β-actin analysed using SDS–PAGE. Blot is representative of two independent experiments. (c) 293 T cells were mock treated, infected with A/PR8 WT or A/PR8 ΔM2 (MOI 3). At 18 h p.i. cells were lysed and levels of NP, β-actin and M2 were analysed using SDS–PAGE. Blot is representative of two independent experiments. (d) 293 T cells were mock-treated, infected with A/WSN/33, A/PR8 WT or A/PR8 ΔM2 (MOI 3), or treated with 100 μM chloroquine (CQ) or 1 μM Rapamycin for 18 h. Cells were then lysed and levels of NP, β-actin and LC3 were analysed using SDS–PAGE. Blot is representative of two independent experiments. (e) To test the specificity of the GTP-Rab7 antibody, Total- and GTP-bound Rab7 intensities were simultaneously acquired in cells that are either transfected with eGFP-Rab7 WT, a dominant negative Rab7 mutant with higher GDP affinity (eGFP-Rab7 T22N), or a constitutively active GTP-bound Rab7 mutant (eGFP-Rab7 Q67L) for 24 h. Representative images from two independent experiments show Rab7 (GFP, green) and GTP-Rab7 (red) staining. Scale bar = 10 μm. (f) Representation of generation of mask to detect nuclei and cells positive for eGFP-Rab7 signal (see material and methods). Images are representative of two independent experiments. Scale bar = 10 μm.
