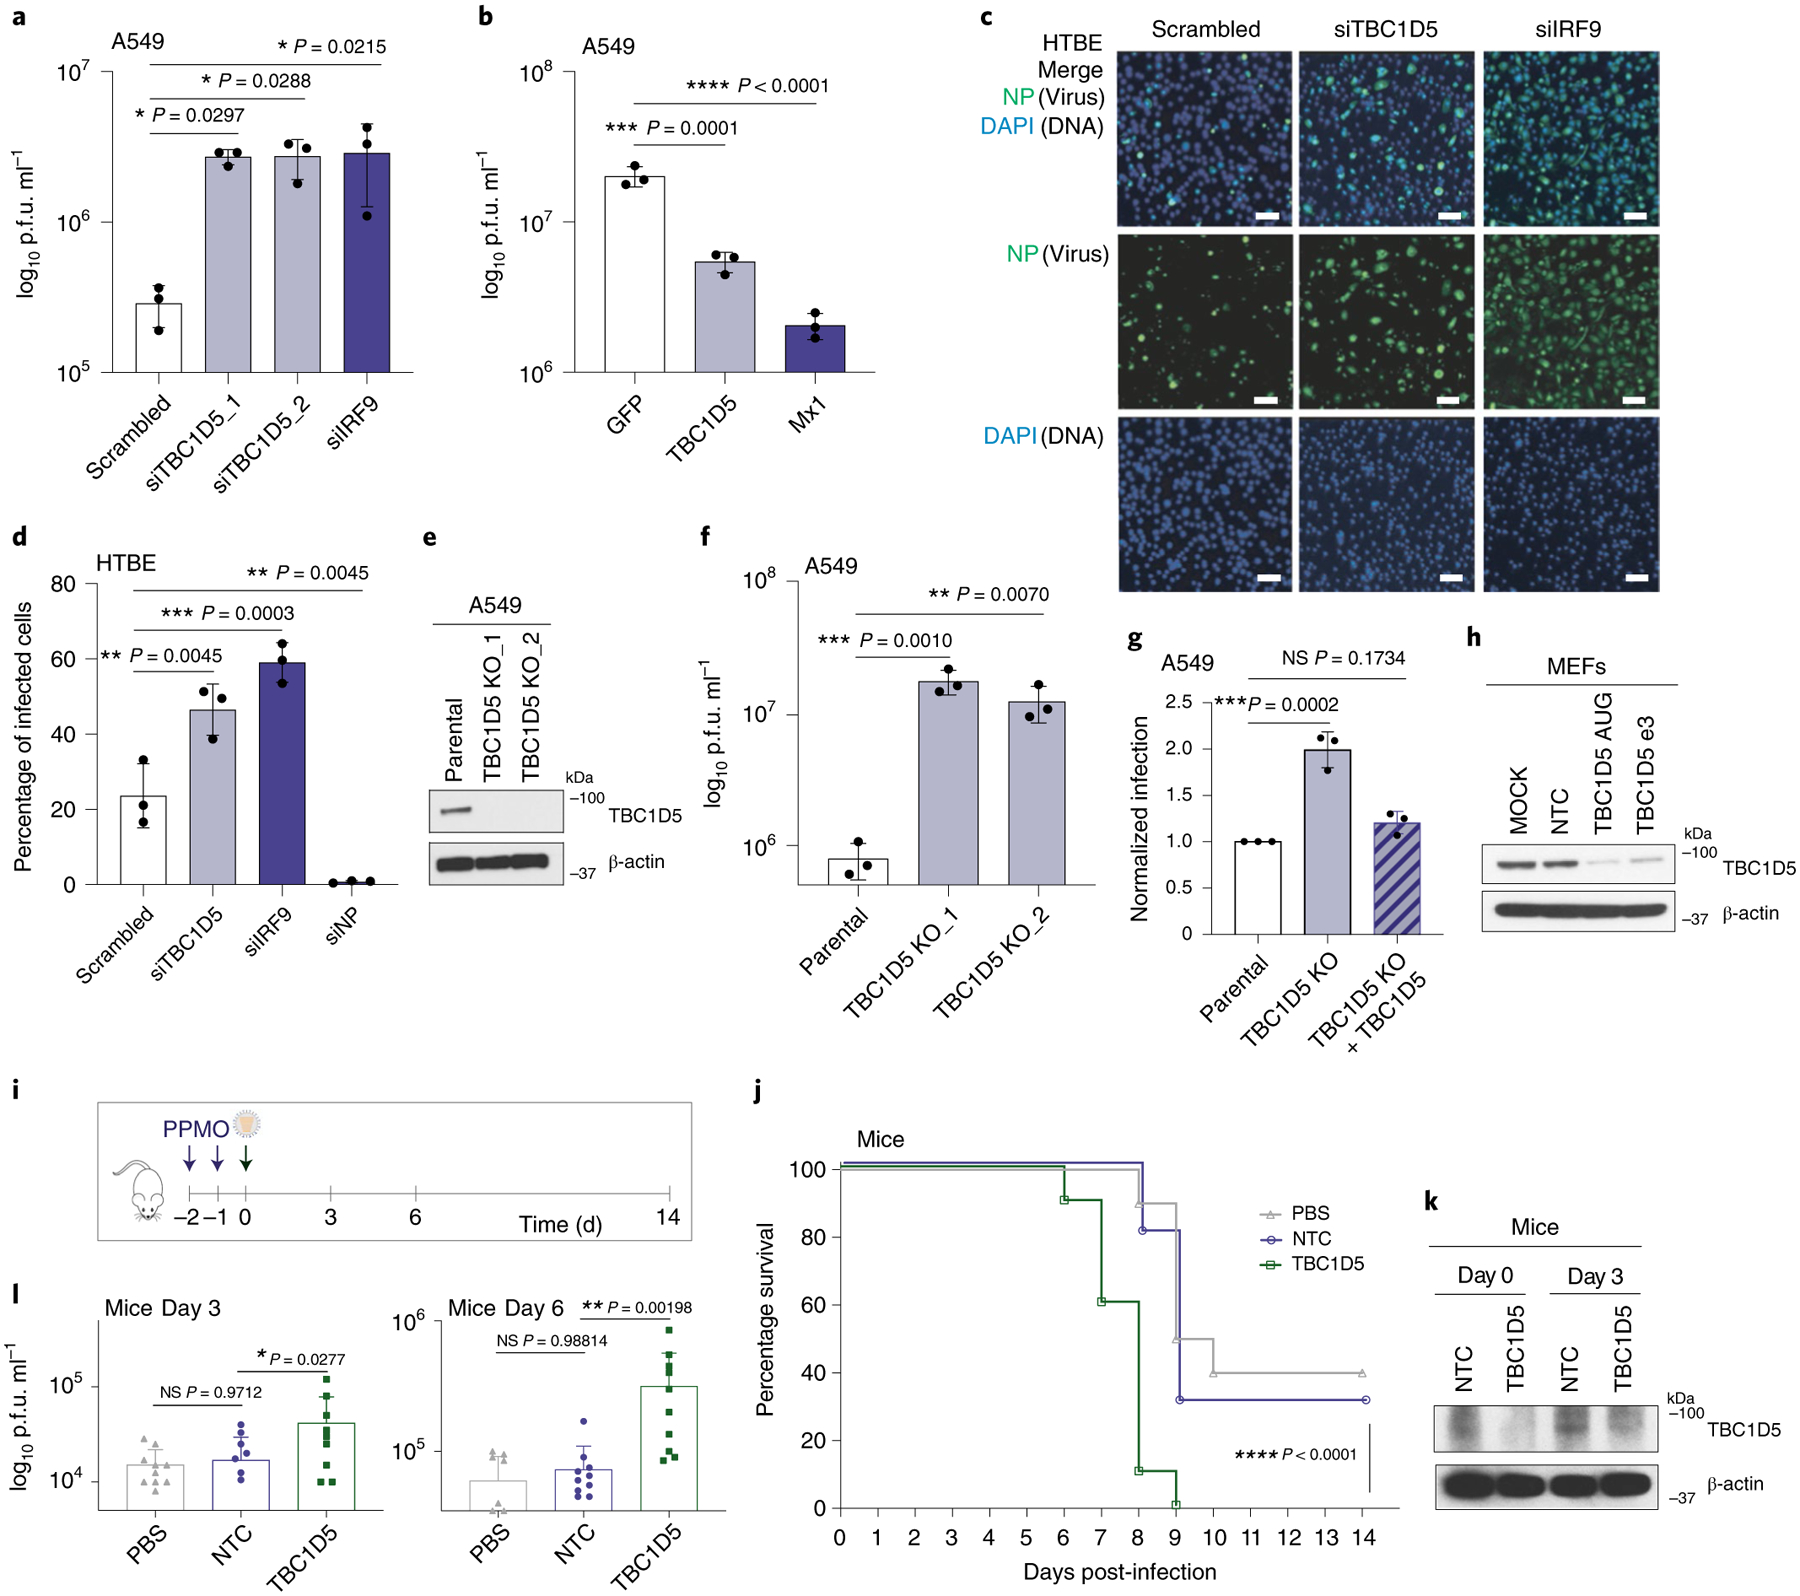
Fig. 3 |. TBC1D5 restricts IAV replication in vitro, ex vivo and in vivo.

a, A549 cells were transfected with indicated siRNAs for 48 h before infection with A/WSN/33 (MOI 0.01). Supernatants were analysed at 48 h postinfection (h p.i.) by plaque assay. Data represent mean ± s.d. of three independent experiments (n = 3). b, A549 cells were transfected with indicated plasmids (10 ng) for 36 h and infected with A/WSN/33 (MOI 0.01). At 48 h p.i., supernatants were analysed by plaque assay. Data show mean ± s.d. from one representative experiment in triplicate (n = 3). c,d, HTBE cells were transfected for 36 h with indicated siRNAs before A/WSN/33 infection (MOI 1). At 24 h p.i., cells were immunolabelled with NP antibody. Representative images are shown in c. Scale bar, 10 μm. Quantification (d) shows mean ± s.d. of three independent experiments (n = 3). e, Protein analysis of A549 parental and TBC1D5 KO clones. Blot is representative of three independent experiments. f, A549 parental and TBC1D5 KO cells were infected with A/WSN/33 (MOI 0.01) for 48 h and supernatants analysed by plaque assay. Data show mean ± s.d. from one representative experiment in triplicate (n = 3). g, Parental, TBC1D5 KO and TBC1D5 KO + 10 ng of TBC1D5 cells were infected with A/WSN/33 (MOI 0.1) for 24 h before immunolabelling with NP antibody. Data show mean ± s.d. normalized infection from one representative experiment in triplicate (n = 3). h, MEFs were treated with indicated PPMOs or PBS for 72 h and subjected to SDS–polyacrylamide gel electrophoresis (SDS–PAGE) and immunoblotting. Blot is a representative from two independent experiments. i, Schematic representation of mouse experiments. j, Mice survival was monitored for 14 d p.i. Shown is percentage survival ± s.d. from two independent experiments, each with five mice per condition (n = 10). k,l, On days 3 and 6 p.i., mice were euthanized to harvest the lungs and determine TBC1D5 expression (k) and virus titre (l). Blot is a representative from two independent experiments (k). Graph shows mean lung virus titre ± s.d. from two independent experiments each with five mice per condition (n = 10) (l). Statistical significance was calculated using one-way analysis of variance (ANOVA) with Dunnett’s post hoc test (a,b,d,f,g) or log rank Mantel–Cox test (j). l, Two-way ANOVA test and Dunnett post hoc test were conducted by adding experiment batch as a covariate along with PPMO treatment effect. NS, not significant.
