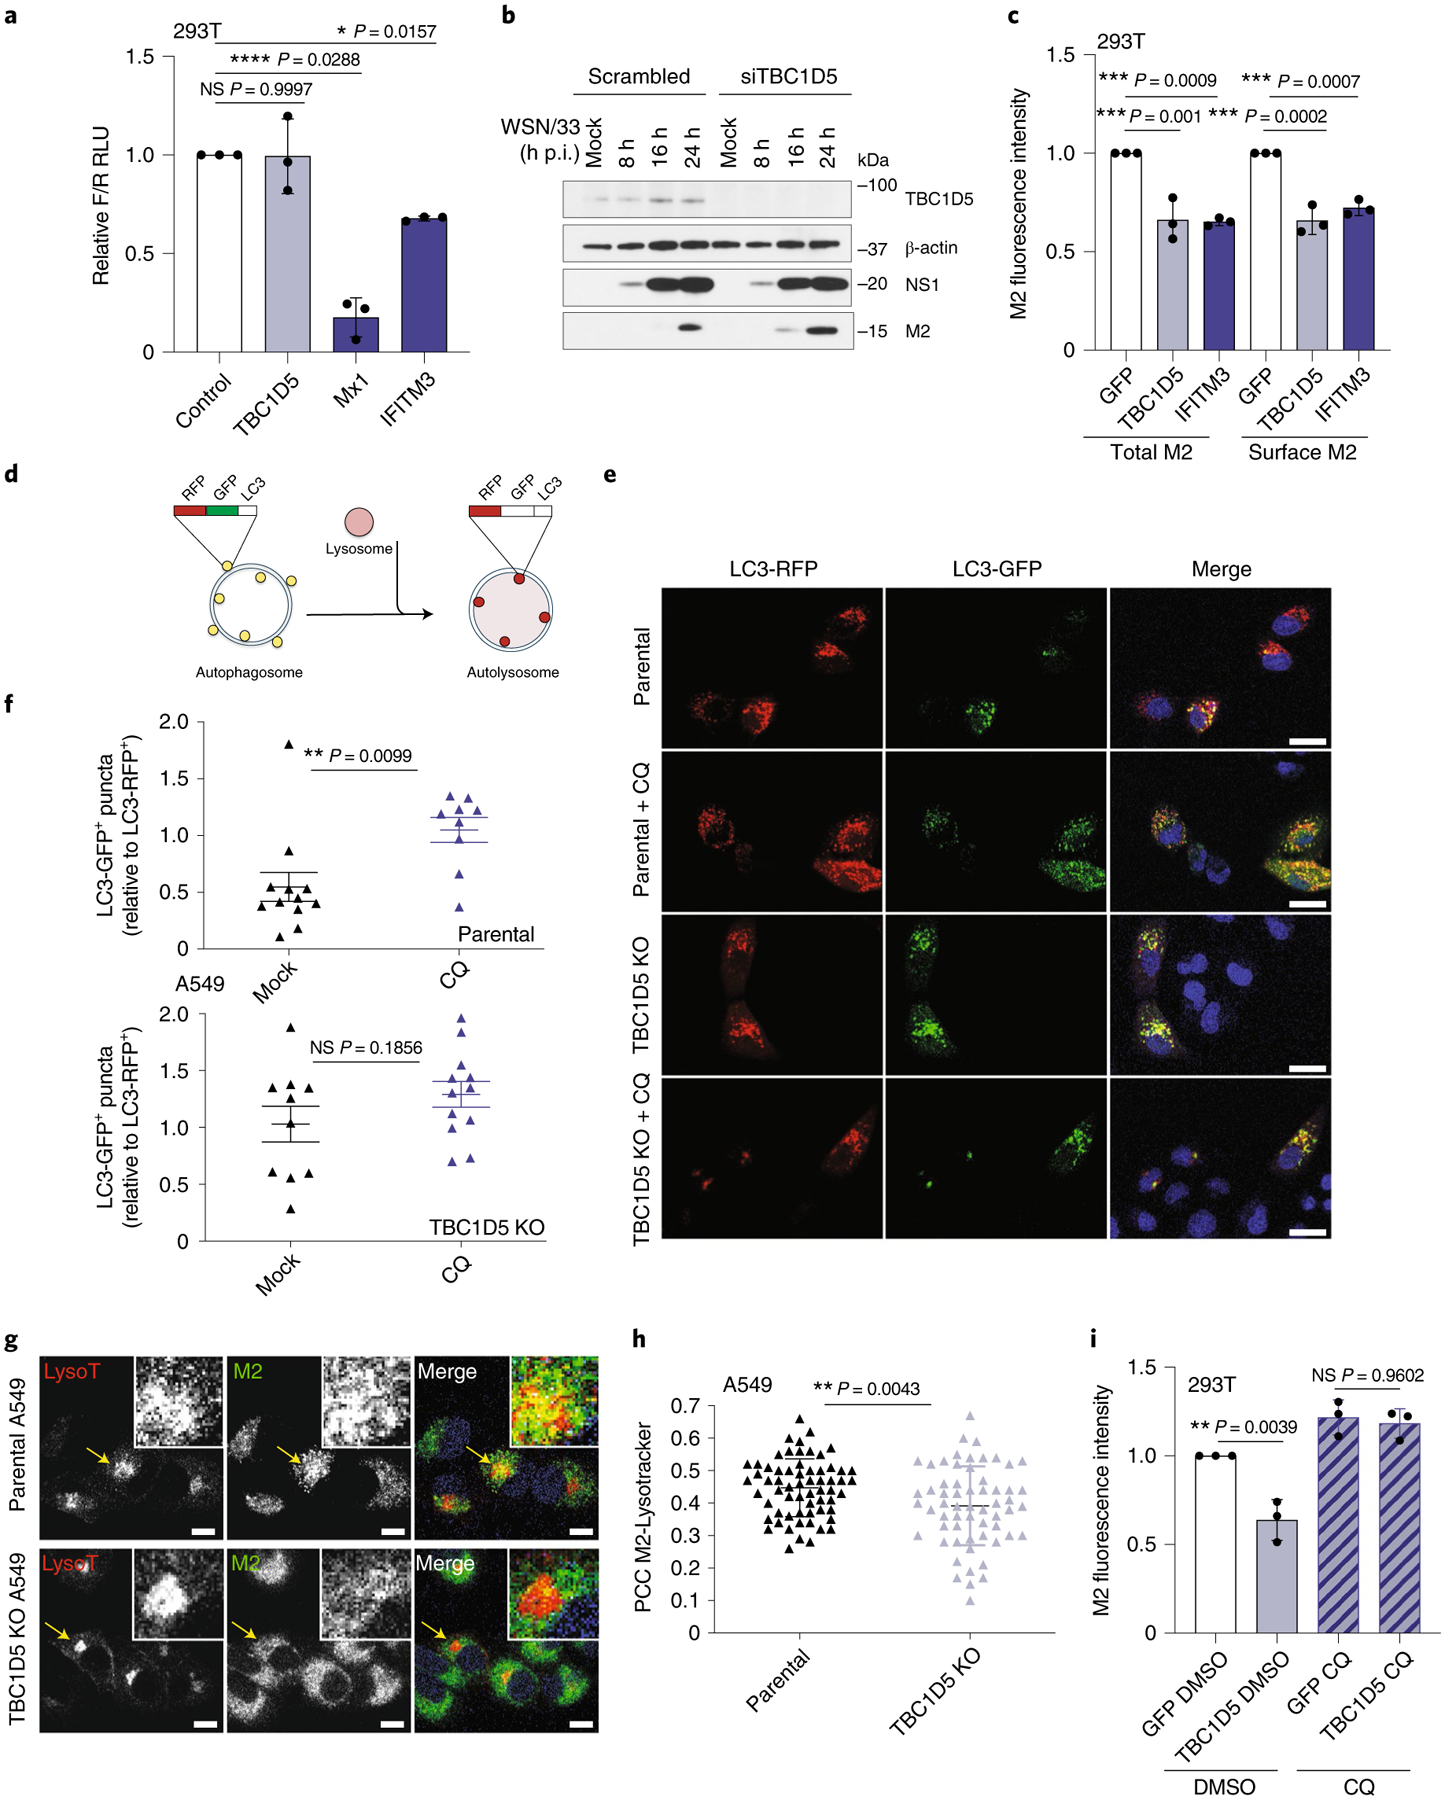
Fig. 5 |. TBC1D5 promotes lysosomal targeting of IAV M2 protein.

a, 293T cells were transfected with indicated plasmids, a firefly (F) influenza minigenome reporter and transfection control renilla (R). At 24 h post-transfection, cells were infected with A/WSN/33 (MOI 5) for 16 h and the levels of F/R measured. Data represent mean ± s.d. of F/R RLU from three independent experiments (n = 3). b, 293T cells were treated with indicated siRNAs for 48 h before infection with A/WSN/33 (MOI 2). At indicated h p.i., protein levels were analysed using SDS–PAGE. Blot is representative of two independent experiments. c, 293T cells were transfected with indicated expression constructs and infected with A/WSN/33 (MOI 1). At 18 h p.i., cells were immunolabelled with anti-M2 in the presence (total M2) or absence (surface M2) of cell permeabilization agent and M2 fluorescence levels measured by flow cytometry. Data represent mean ± s.d. of three independent experiments (n = 3). d, RFP-GFP-LC3B reporter. e, Parental and TBC1D5 KO cells were transduced with BacMam 2.0 RFP-GFP-LC3B for 24 h, infected with A/WSN/33 (MOI 3) or treated with 100 μM CQ and, 16 h later, the relative number of LC3-GFP+ /LC3-RFP+ puncta per cell were quantified. Images are representative of three independent experiments. Scale bar, 10 μm. f, Data show mean ± s.e.m. LC3-GFP+ /LC3-RFP+ puncta per cell from one representative experiment where at least nine cells per condition were quantified (n = 9). g, A549 parental and TBC1D5 KO cells were infected with A/WSN/33 (MOI 3). At 7 h p.i., cells were treated with 70 nM Lysotracker, incubated for 1 h and then labelled with anti-M2. Images are representative of two independent experiments. Scale bar, 10 μm. h, PCC of M2-Lysotracker colocalization. Data show mean ± s.d. from one representative experiment where at least 50 cells per condition were quantified (n = 50). i, 293T cells were transfected with indicated expression constructs and infected with A/WSN/33 (MOI 1). At 4 h p.i., cells were treated with 100 μM CQ for 12 h p.i. and subjected to M2 immunolabelling in the absence of permeabilization agent. M2 mean fluorescence levels were recorded by flow cytometry. Data represent mean ± s.e.m. of three independent experiments (n = 3). Statistical significance was calculated using one-way ANOVA with Dunnett’s (a,c) or Tukey’s multiple comparisons post hoc (i) or two-tailed unpaired Student’s t-test (f,h).
