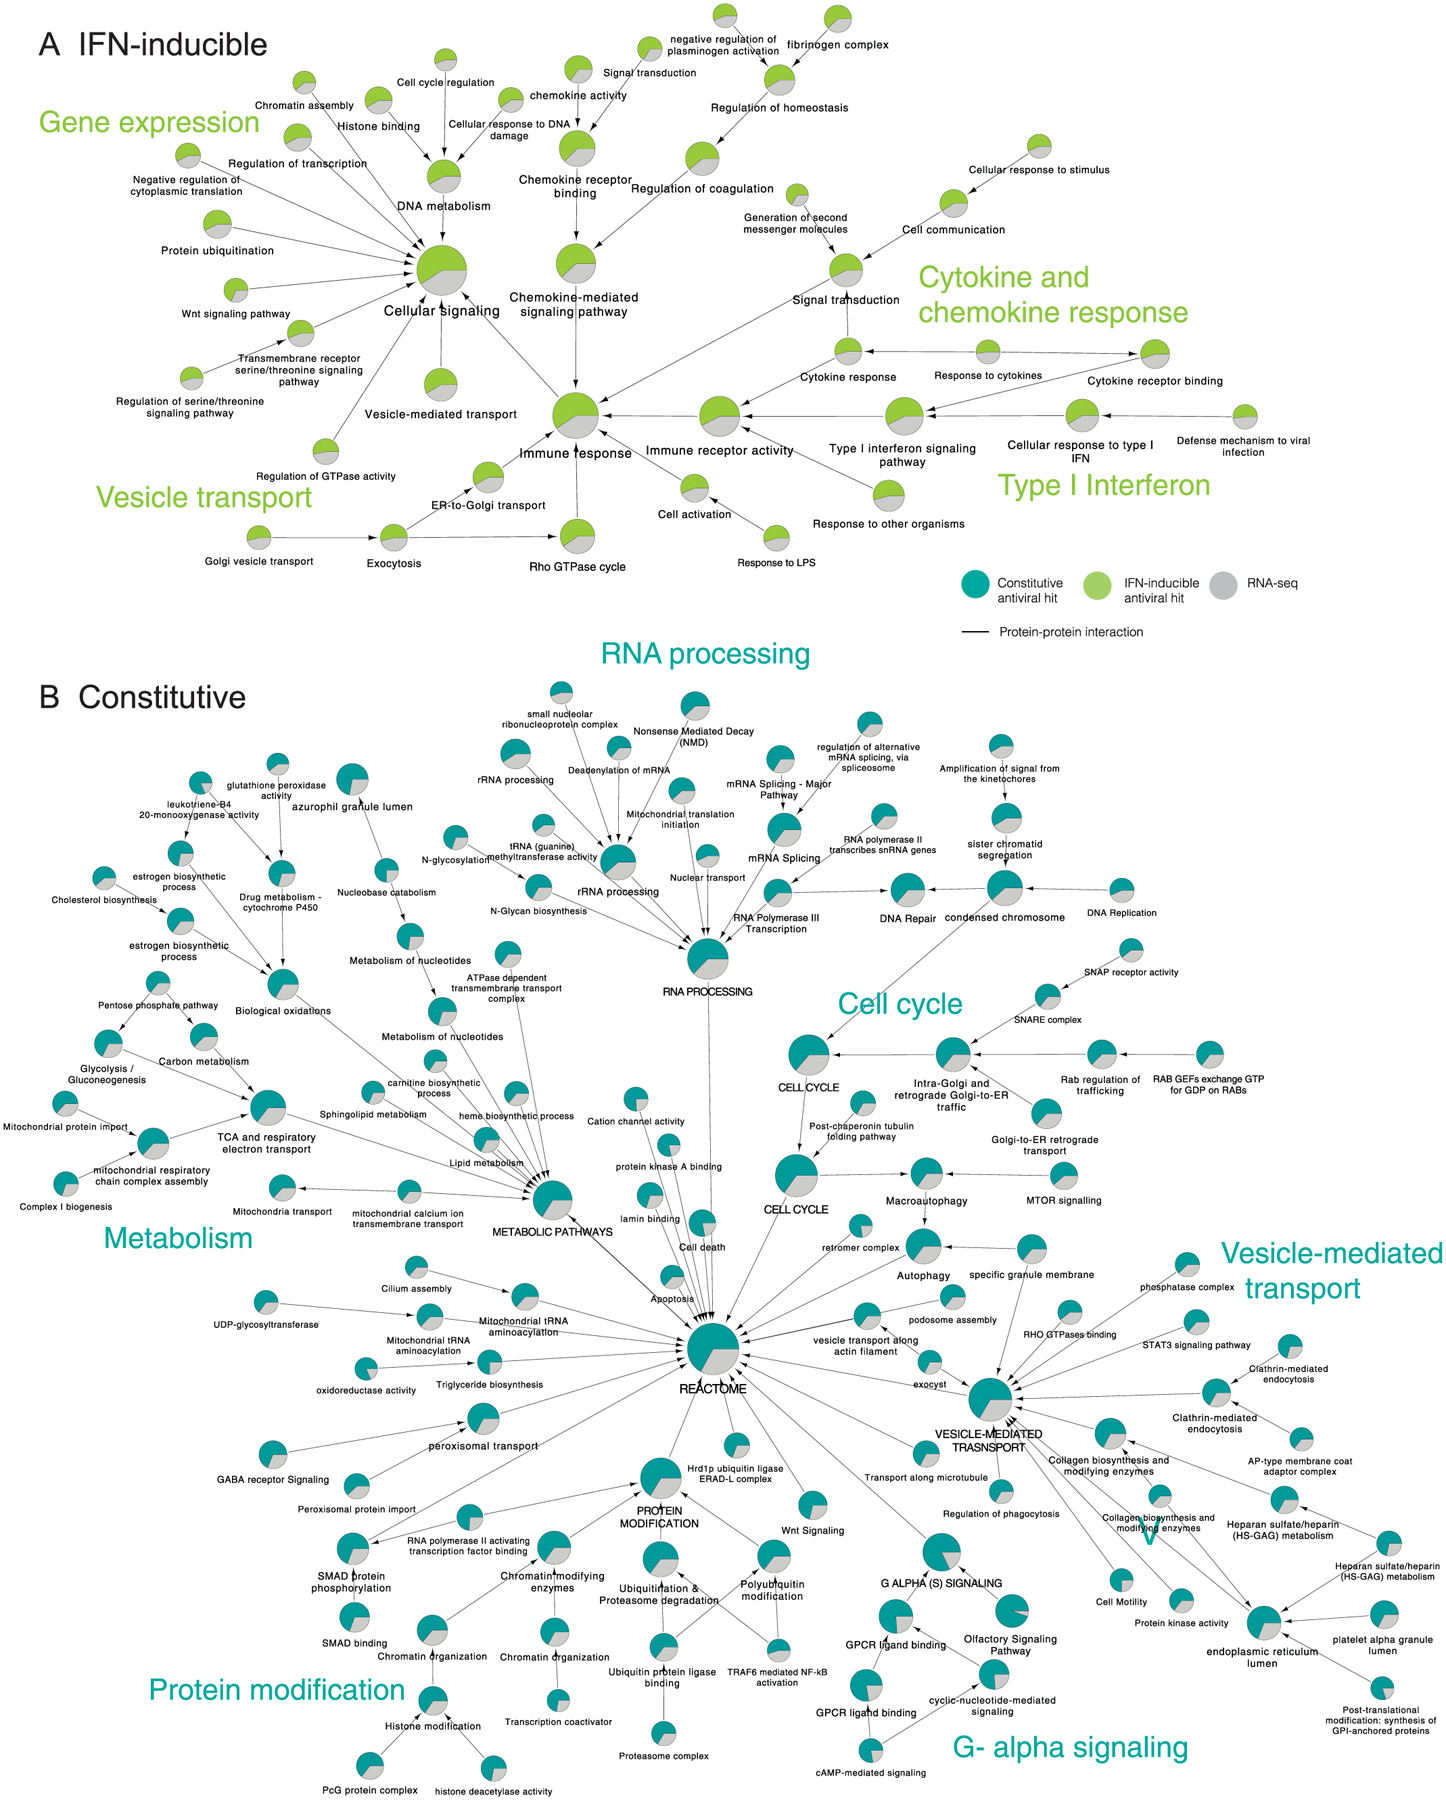
Extended Data Fig. 2 |. Global analysis of IAV cellular restriction.

The list of factors identified by siRNA screening (z-score ≥ 0.5), or RNA-seq (log2FC ≥ 1.0 or ≤ −1.0 and P value < 0.005) were subjected to supervised community detection71,76. The resultant hierarchy is shown. Here, each node represents a community of densely interconnected proteins, and each edge (arrow) denotes containment of one community (edge target) by another (edge source). Enriched biological processes are indicated. The percentage of each community that corresponds to siRNA hits is shown in green, and RNA-seq in grey. Nodes indicate proteins, and edges indicate interactions as defined by STRING (High Confidence (Score ≥ 0.7), available at NDEx. (a) Hierarchy of IFN-inducible antiviral factors. (b) Hierarchy of constitutive expressed antiviral factors.
