Figure 1.
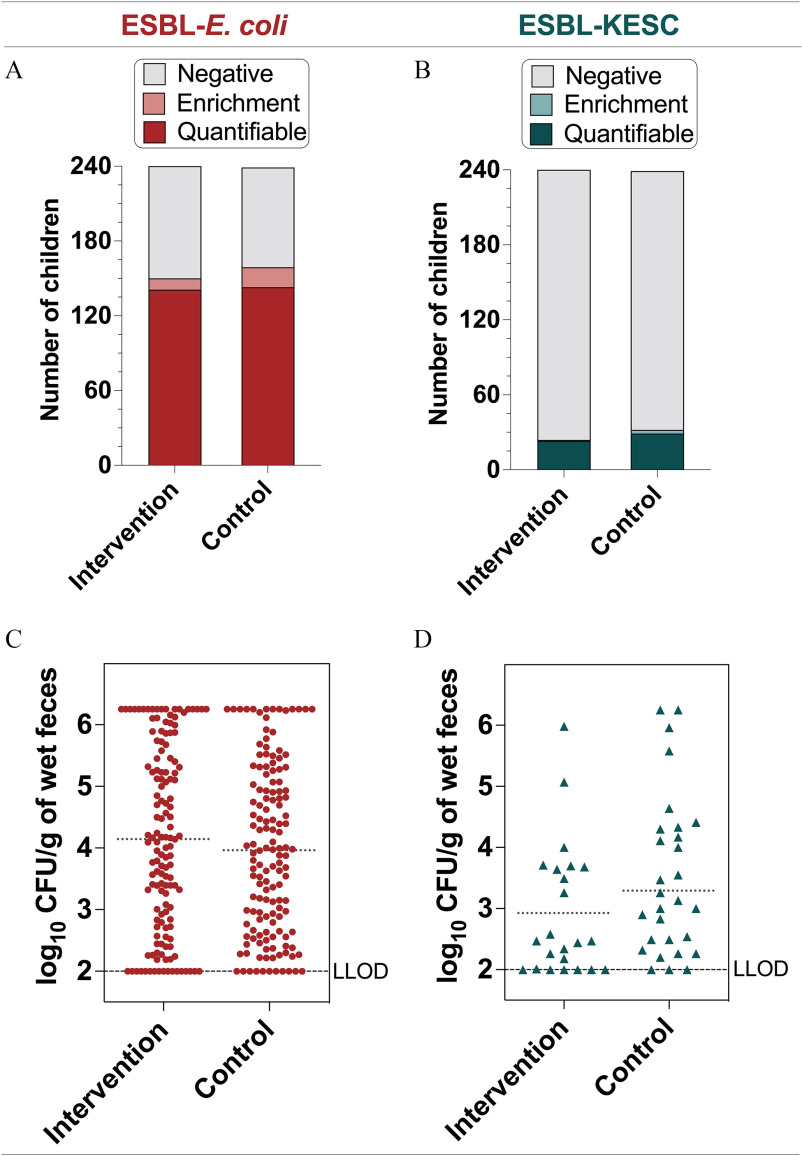
Fecal carriage rates of (A) ESBL-E. coli and (B) ESBL-KESC in the intervention () and control () groups. The term negative was assigned to samples where no growth was observed after direct plating onto CHROMID ESBL agar or after the enrichment step; enrichment corresponds to samples with presumptive ESBL-E. coli colonies after the enrichment step; and quantifiable corresponds to samples with presumptive ESBL-E. coli colonies after direct plating onto CHROMID ESBL agar. Concentrations of (C) ESBL-E. coli and (D) ESBL-KESC in the intervention and control groups among samples with direct positive cultures (quantifiable). The dotted horizontal line is the mean log10 CFU/g-wet feces in the intervention and control groups; the LLOD is indicated. Note: CFU, colony forming units; ESBL, extended-spectrum beta-lactamase-producing; KESC, the Klebsiella spp., Enterobacter spp., Serratia spp., and Citrobacter spp. group; LLOD, lower limit of detection.

