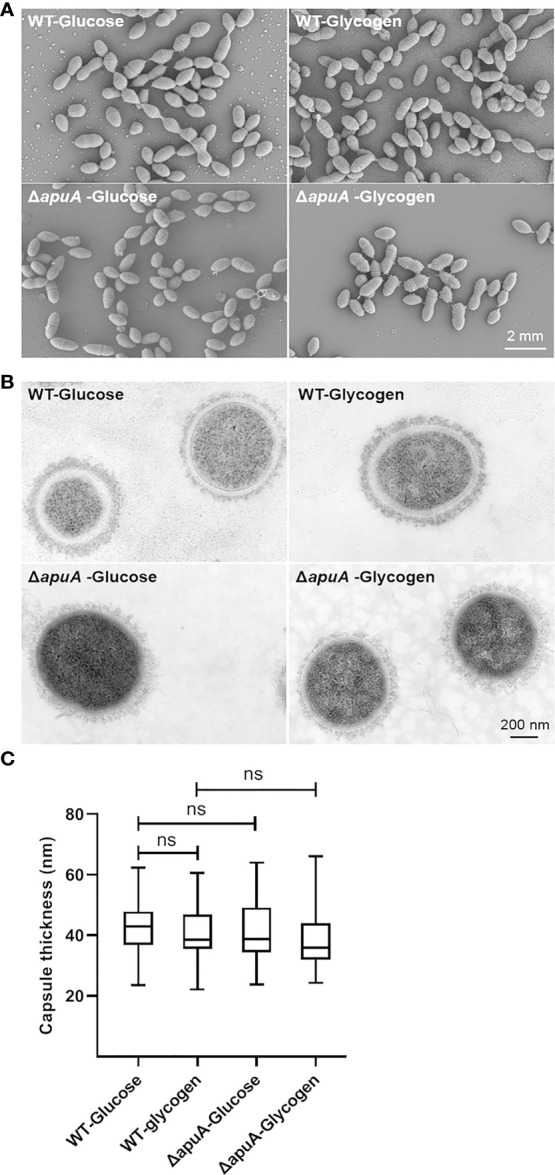
Figure 6.

Bacterial morphology characterization of WT and ΔapuA in the presence of different media. (A) Scanning electron micrographs. (B) Transmission electron micrographs. (C) Comparative analysis of capsule thickness. Data are presented as box-and-whisker plot (minimum to maximum). Statistical analyses were performed via unpaired Student’ s t tests (ns, P > 0.05).
