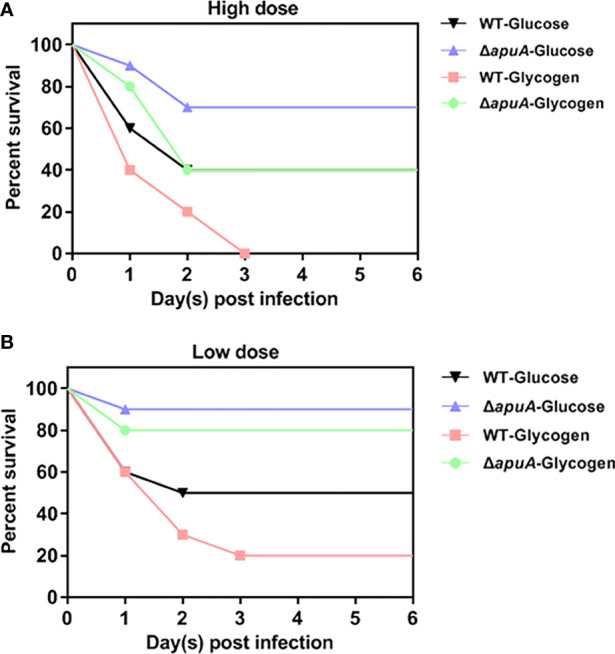
Figure 8.

Survival curves of worms challenged with (A) high- and (B) low-dose bacteria. Ten worms were used in each group. Eight groups were inoculated with high- and low-dose inoculum. Two groups inoculated with inactivated and glycogen-induced WT bacteria were served as negative controls in the high- and low-dose groups. Survival rates of two negative control groups were 100% (not shown).
