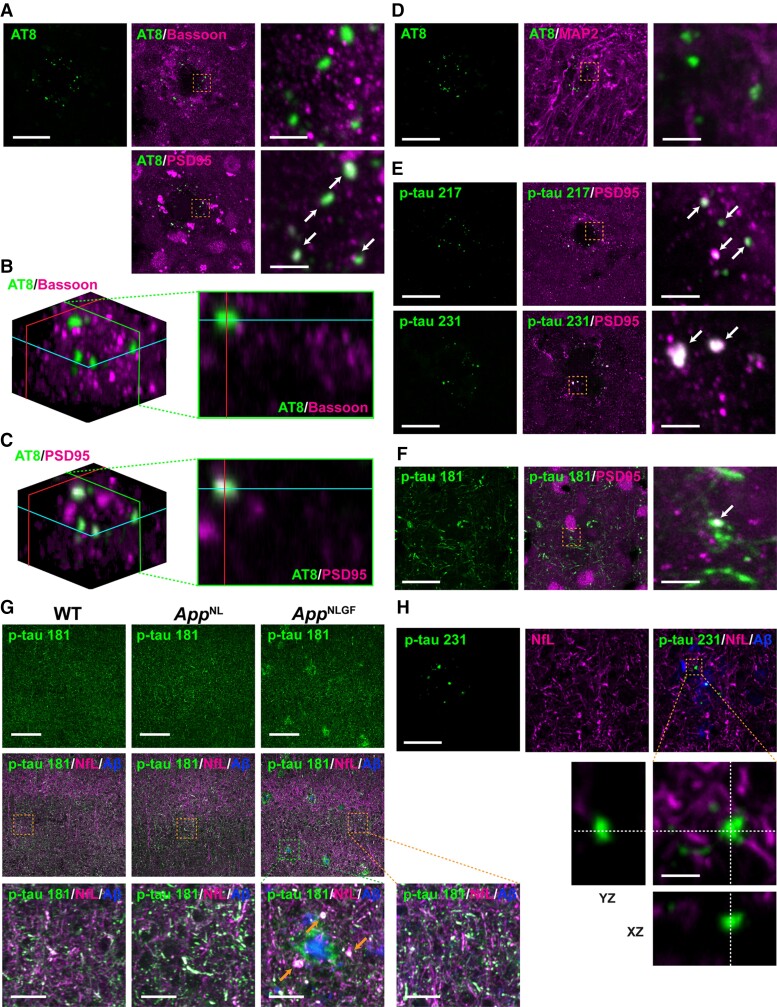
Figure 4.
Colocalization of p-tau 217, 231 and 202/205/208 (AT8) with a postsynaptic marker, PSD95. (A) Representative images of cortices from frozen coronal brain sections immunostained with antibodies against p-tau 202/205/208 (AT8) and the pan-presynaptic marker Bassoon or the glutamatergic postsynaptic marker PSD95. (B, C) 3D images reconstructed using the Fiji volume viewer plugin, showing that AT8 colocalized with PSD95, but not with Bassoon. A cross-sectional view along the green line in the 3D images is shown. (D–F) Co-immunostaining of cortices with antibodies against (D) AT8 and the neuronal dendritic marker MAP2, (E-F) p-tau 217, 231 or 181 and PSD95. Scale bars, 20 μm. The right panel shows higher magnification views of the corresponding dashed orange squares; scale bars, 2.5 μm. White arrows show colocalization. (G) Representative images of cortices immunostained with antibodies against p-tau 181 and the axonal marker NfL. Aβ plaques are stained with FSB. Scale bars, 100 μm. The bottom panel shows higher magnification views of the corresponding dashed orange and green squares; scale bars, 10 μm. Orange arrows show aberrant fibre structures. (H) Representative images of cortices immunostained with antibodies against p-tau 231 and the axonal marker NfL. Aβ plaques are stained with FSB. Scale bars, 20 μm. Orthogonal views of different planes (yz, xz) of higher magnification images from the corresponding dashed orange squares are shown on the bottom. Scale bars in the orthogonal views, 2.5 µm.

