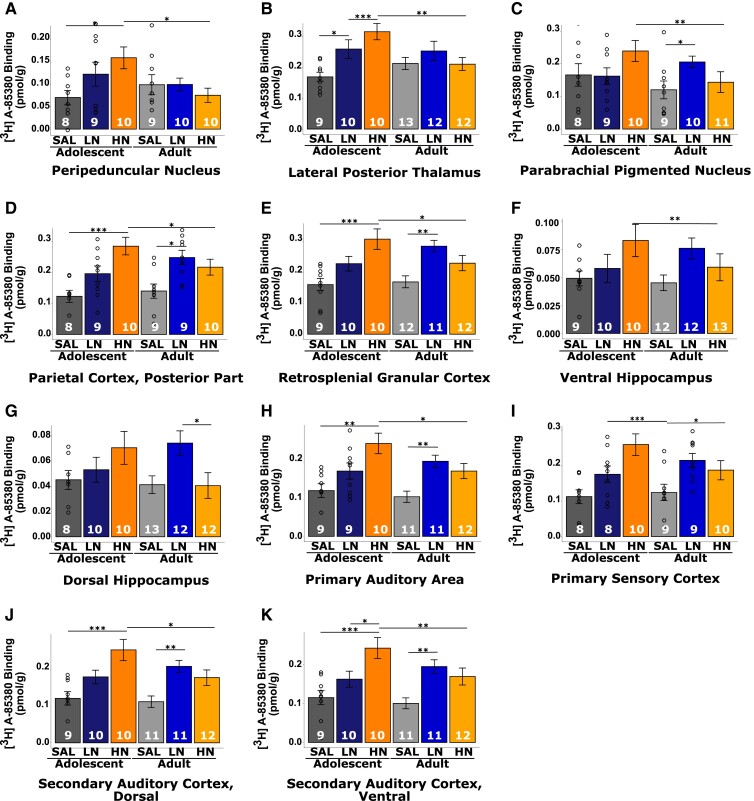
Figure 4.
Graphs of [3H]A-85380 binding in ROIs with a significant nicotine dose × age interaction. (A–K) Graphical depiction of the regional dose × age interactions shown in Fig. 3. Individual two-way ANOVAs were conducted followed by pairwise t-tests with Bonferroni correction for multiple comparisons. Bars represent mean ± SEM, and individual data points represent receptor binding of a brain region for an individual rat. * P < 0.05. ** P < 0.01. *** P < 0.001.

