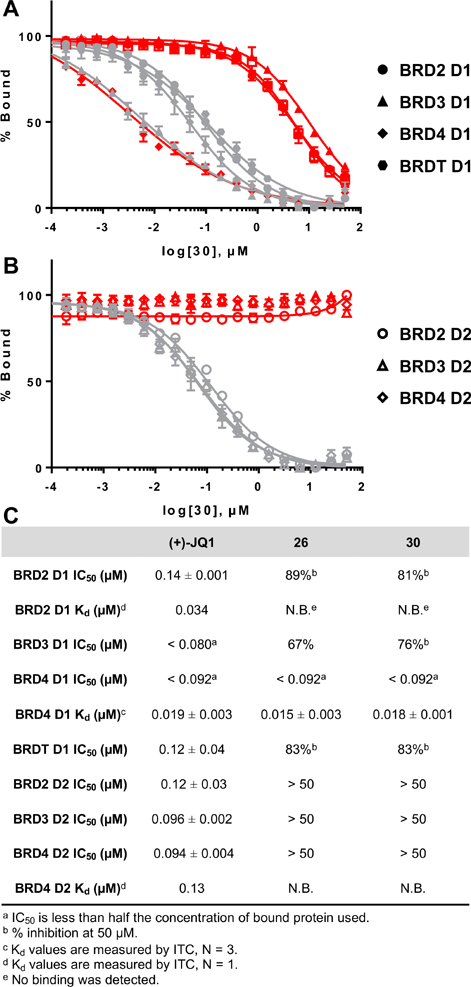
Figure 4.
Selectivity and affinity of leading molecules 26, 30, and (+)-JQ1 against BET bromodomains by FA and ITC. (A) Competitive binding curves of 30 in red and (+)-JQ1 in gray against D1s. (B) Competitive binding curves of 30 in red and (+)-JQ1 in gray against D2s. (C) IC50 values of (+)-JQ1, 26, and 30 by FA and Kd values by ITC.

