
Table 2.
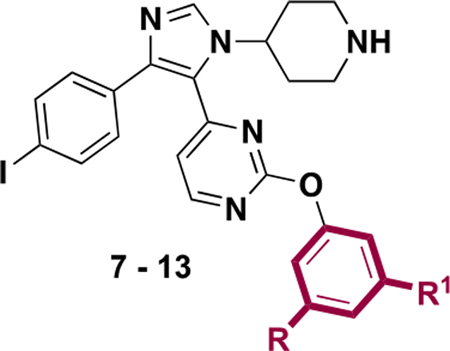
IC50 Values of Inhibitors 7–13 against BRD4 D1 by Fluorescence Anisotropy
| |||
|---|---|---|---|
| compd | R | R1 | BRD4 D1 IC50 by FA (μM)a |
| (+)-JQ1 | <0.092b | ||
| 7 | Me | Me | 0.19 ± 0.02 |
| 8 | H | H | 2.4 ± 0.1 |
| 9 | H | Me | 0.50 ± 0.04 |
| 10 | H | Et | 0.20 ± 0.01 |
| 11 | H | t-Bu | 0.11 ± 0.03 |
| 12 | Me | Et | <0.092b |
| 13 | Cl | Cl | 0.43 ± 0.05 |
a
Data represents the mean and standard deviation of three experimental replicates.
b
IC50 is less than half the concentration of bound BRD4 D1 used.