
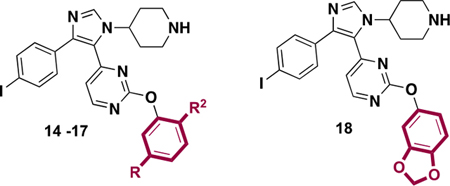
Table 3.
IC50 Values of Inhibitors 14–18 against BRD4 D1 by Fluorescence Anisotropy
| |||
|---|---|---|---|
| compd | R | R2 | BRD4 D1 IC50 by FA (μM)a |
| (+)-JQ1 | <0.092b | ||
| 14 | Me | Me | 0.27 ± 0.04 |
| 15 | i-Pr | Me | <0.092b |
| 16 | H | OH | 3.0 ± 0.1 |
| 17 | H | OMe | 2.4 ± 0.1 |
| 18 | 2.7 ± 0.3 | ||
a
Data represents the mean and standard deviation of three experimental replicates.
b
IC50 is less than half the concentration of bound BRD4 D1 used.