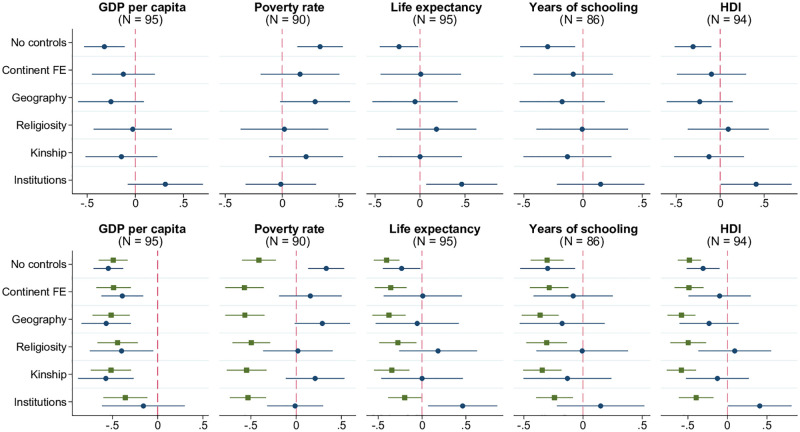
Fig 8. Witchcraft beliefs and development.
Each panel in the top row of the figure presents the results of estimating 6 different models, in which the prevalence of witchcraft beliefs at the country level is regressed on the metric of development indicated in the panel title, along with a set of control variables. The latter is defined as follows according to the tickmarks on the vertical axis: 1) none for “No controls”, 2) only continental fixed effects for “Continent FE”, 3) continental fixed effects and baseline geographic controls (absolute latitude, terrain ruggedness, agricultural suitability of land, distance to the coastline) for “Geography.” The remaining 3 models, named “Religiosity,” “Kinship,” and “Institutions” include, respectively, average religiosity, kinship intensity index, and the rule-of-law index (in addition to continental fixed effects and geographic variables). The round marker represents the point estimate for the coefficient on the respective development indicator, and the linear segment around each marker is the corresponding 95% confidence interval based on heteroskedasticity-robust standard errors. Model specifications for the bottom row of the figure are identical, but the right-hand side of the regression equation includes both the linear and quadratic terms for development indicators. The square and round markers and associated confidence intervals in the bottom-row panels correspond to the coefficient estimates on the square and linear terms, respectively. Sample size N indicated in parentheses. The key variables are standardized to have zero mean and unit standard deviation in relevant samples.

