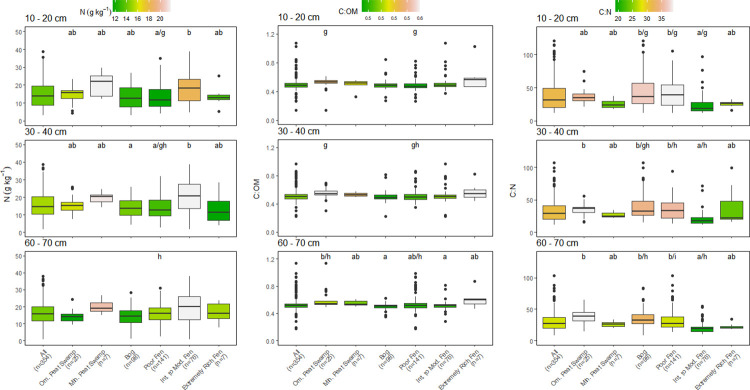
Fig 5. Comparison of nitrogen (N) concentration, carbon (C):organic matter (OM) ratios, and C:N ratios of all sampling locations by peatland class for matching cores at 10–20 cm, 30–40 cm, and 60–70 cm depth increments.
Box center are medians, box limits are 25th and 75th percentiles, whiskers are 1.5 times the interquartile range, and dots beyond whiskers are outlying points. Significant differences between peatland classes (a-e) or depth (f-h) are denoted by differing letters (p<0.05).

