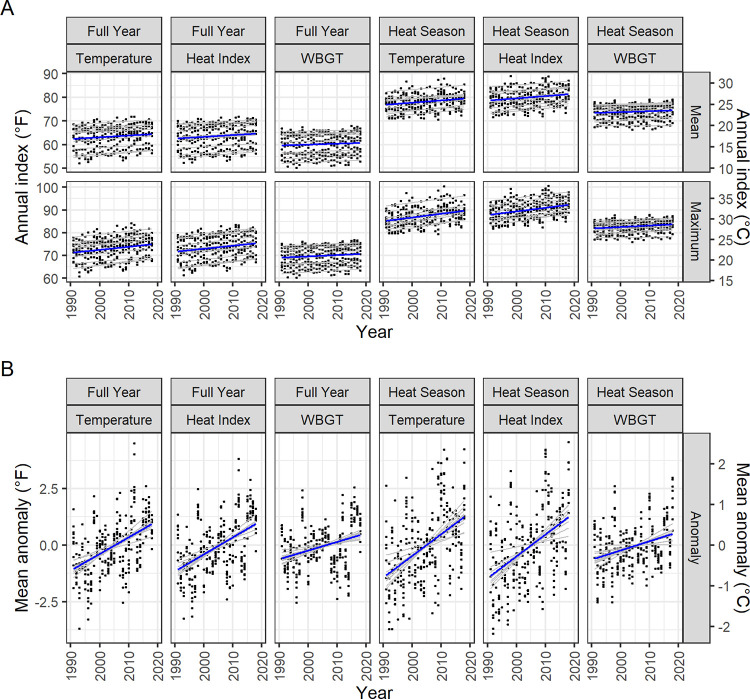
Fig 3. Annual trends of full-year and heat season degree-based indices of heat at 10 CONUS U.S. Army installations, 1991–2018.
Panel A displays annual means of mean and maximum daily index values. Panel B displays annual means of daily anomalies, relative to location-based 1990–2019 climatologies. Thick blue lines depict the linear trend through all data points. Thin gray lines depict location-specific trends. Indices are in°F on the left y-axis and in°C on the right y-axis.

