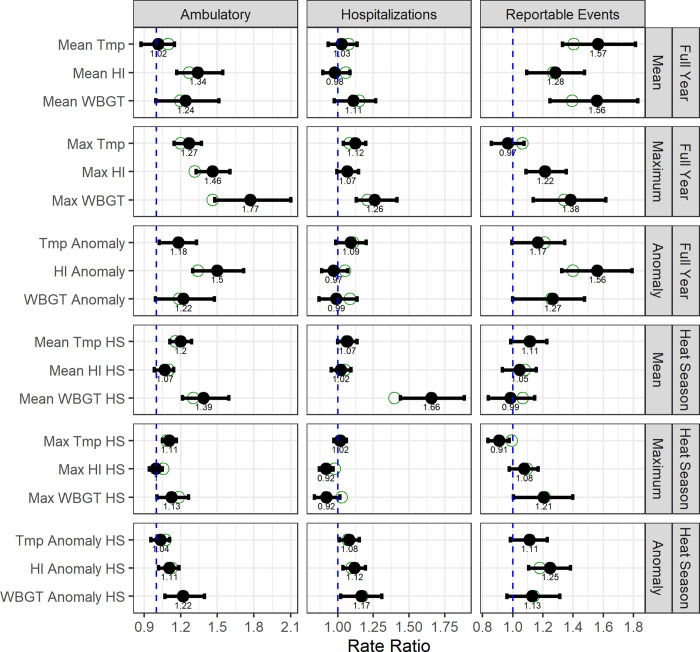
Fig 4. Rate ratios for full-year and heat season indices of heat and HSI encounters at 10 CONUS U.S. Army installations.
RRs per 1 degree increase in annual index of heat (mean of daily means) from 2-year block bootstrap negative binomial models with basic (empirical) confidence intervals based on 2,000 replicates, controlling for installation-level effects. Solid points reflect the mean of bootstrap estimates and unfilled points reflect the original sample (non-bootstrap) estimate. The dashed blue vertical lines depict a RR of 1.0, indicative of no increased risk.

