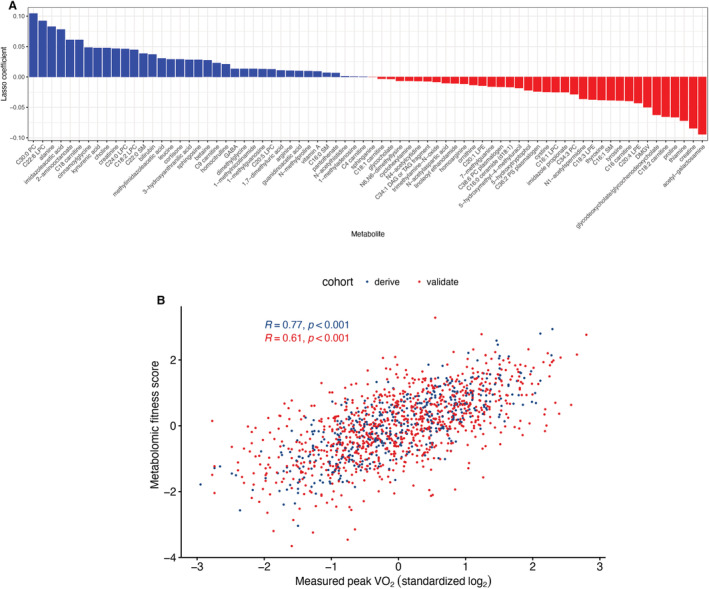
Figure 2. Developing the metabolomic fitness score in the FHS (Framingham Heart Study).

A, Coefficients of metabolites from least absolute shrinkage and selection operator (LASSO) regressions that are used in calculation of the metabolomic fitness score. Abbreviations for metabolite names are expanded in Table S2. B, Correlation between the metabolomic fitness score and peak oxygen uptake (VO2). Peak VO2 is log2‐transformed and standardized. The blue dots represent the FHS derivation group, and the red dots represent the FHS validation group. The noted correlation coefficients (R) and corresponding P values refer to Pearson correlations.
