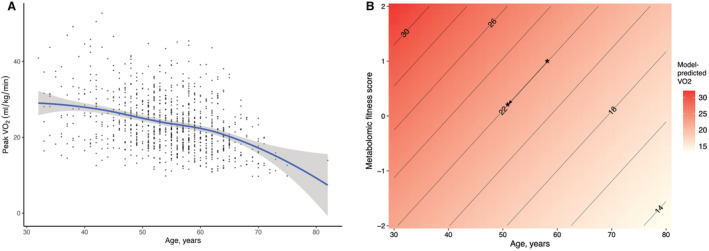
Figure 3. Age, metabolomic fitness score, and peak oxygen uptake (VO2).

A, Relationship between peak VO2 and age in the Framingham Heart Study (in the validation subsample). The blue line with overlaying gray confidence intervals represents a Loess spline across the data. B, Joint effects plot depicting the relation between age, the metabolomic fitness score, and peak VO2. We estimated marginal means for peak VO2 across age and metabolomic fitness score using a fully adjusted linear model as described (see Methods). The contour lines and heat colors represent model‐estimated peak VO2. The metabolic VO2 score is displayed as the mean (0), and each number represents a standard deviation higher or lower than the mean. An illustrative example is shown with an asterisk (*) on the plot; a 60‐year‐old with a metabolomic fitness score ≈1 SD above the mean (ie, 1) has the same peak VO2 as someone ≈51 years old with a metabolomic fitness score at the mean (ie, 0).
