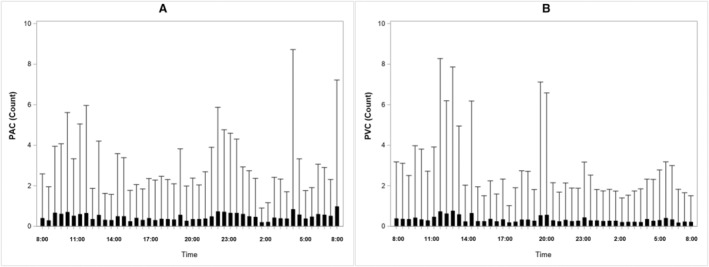
Figure 2. Time‐specific distributions of PAC and PVC counts during the study period.

A, Time‐specific distributions of PAC counts. B, Time‐specific distributions of PVC counts. PAC indicates premature atrial contraction; and PVC, premature ventricular contraction.
