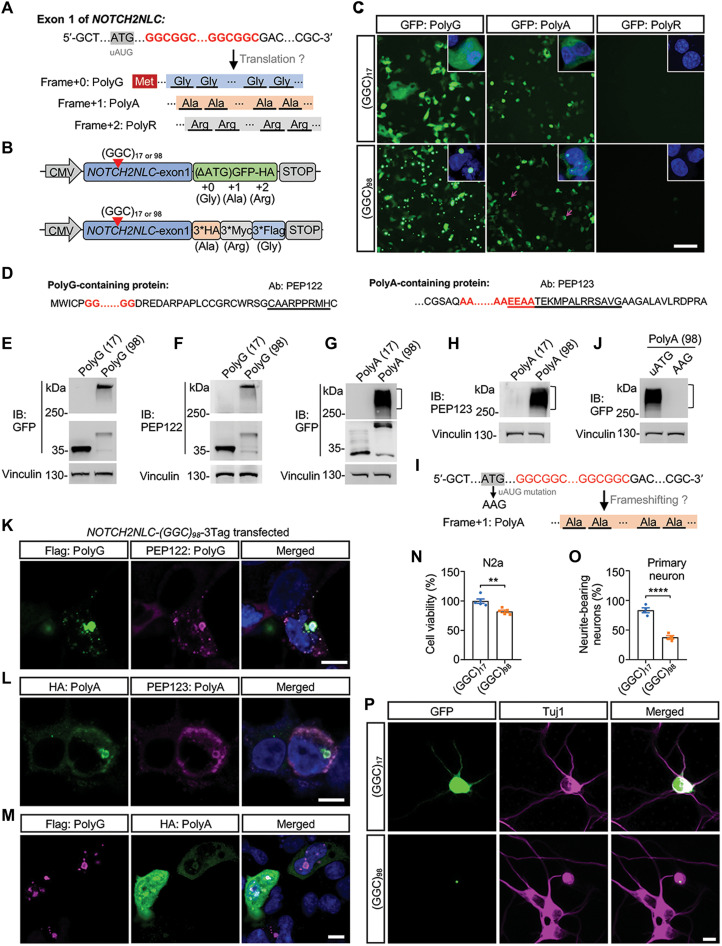
Fig. 1. Expression of NOTCH2NLC-(GGC)98 produces multiple polypeptides and causes cellular toxicity in vitro.
(A) Schematic diagram of the putative mutant NOTCH2NLC proteins. Glycine, Gly; alanine, Ala; arginine, Arg. (B) Schematic diagram of NOTCH2NLC constructs. NOTCH2NLC exon 1 with 17 GGC repeats [(GGC)17 for short] and 98 GGC repeats [(GGC)98 for short] were fused with a GFP tag (start codon removed) or 3*HA/3*Myc/3*Flag (3Tag) tag. (C) Direct GFP fluorescence of HEK293 cells transfected with NOTCH2NLC-GFP constructs. The magenta arrows indicate polyA aggregates. Green, GFP; blue, 4′,6-diamidino-2-phenylindole (DAPI). Scale bar, 100 μm. (D) Putative amino acid sequences of polyG-containing and polyA-containing proteins. The underlined sequences indicated the epitope of antibodies against polyG (PEP122) and polyA (PEP123). Ab, antibody. (E and F) Immunoblotting (IB) of HEK293 cells transfected with NOTCH2NLC-GFP (polyG frame) constructs using anti-GFP and PEP122 antibodies. (G and H) Immunoblotting of HEK293 cells transfected with NOTCH2NLC-GFP (polyA frame) constructs using anti-GFP and PEP123 antibodies. (I) Frameshifting hypothesis for polyA. The production of polyA may result from AUG-initiated ribosomal frameshifting translation. (J) Immunoblotting of HEK293 cells transfected with NOTCH2NLC-GFP (polyA frame with uAUG mutation) construct. (K to M) Coimmunostaining of HEK293 cells transfected with NOTCH2NLC-3Tag construct using anti-Flag and anti-PEP122 (K) or using anti-HA and anti-PEP123 (L) or using anti-Flag and anti-HA (M). Scale bars, 10 μm. (N) Cell viability of Neuro-2a cells transfected with NOTCH2NLC-GFP constructs was analyzed by the Cell Counting Kit-8 (CCK-8) method. Data are presented as means ± SEM. (N = 5 independent experiments, **P = 0.0036, two-tailed t test). (O and P) Cell viability of cultured mouse primary cortical neurons transfected with NOTCH2NLC-GFP constructs. Data are presented as means ± SEM (N = 4 independent experiments, at least 120 cells were counted per experiment, ****P < 0.0001, two-tailed t test). Green, GFP; magenta, Tuj1. Scale bar, 10 μm.

