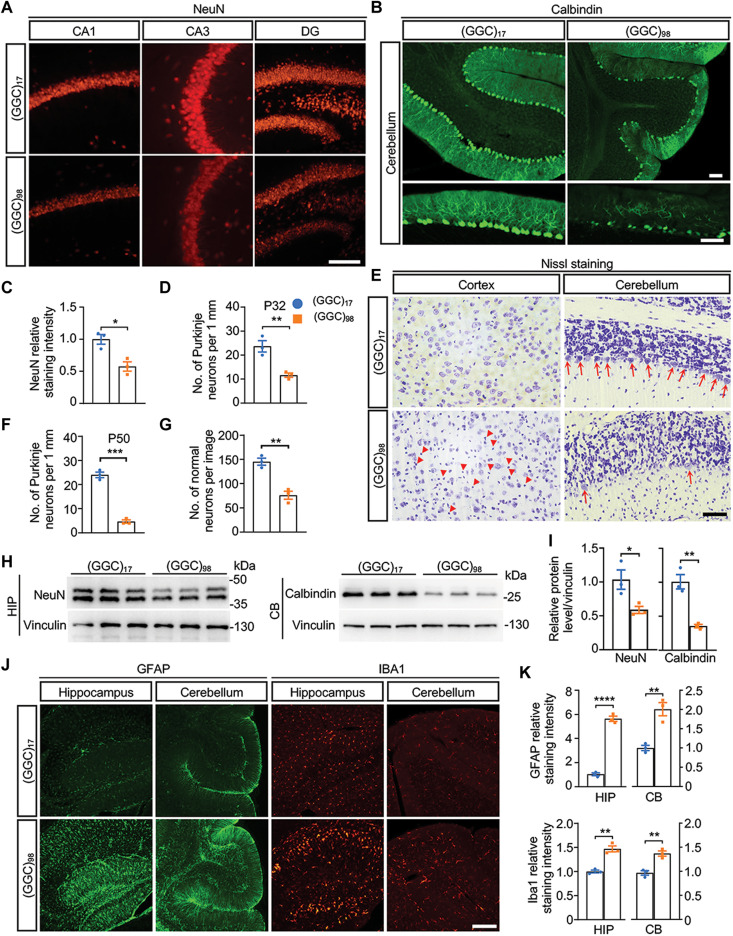
Fig. 3. Expression of NOTCH2NLC-(GGC)98 causes neurodegeneration in mice.
(A and B) Immunofluorescence against NeuN in the hippocampus (A) and calbindin in the cerebellum (B) from NOTCH2NLC mice. Red, NeuN; green, calbindin. Scale bars, 100 μm. (C and D) Quantification of the staining intensity of NeuN (C) and the number of Purkinje neurons (D). Data are presented as means ± SEM. [N = 3 mice per group, *P = 0.0152 (C), **P = 0.0086 (D), two-tailed t test]. (E) Nissl staining of the cortex and cerebellum from NOTCH2NLC-(GGC)17 and NOTCH2NLC-(GGC)98 mice at P50. Red arrowheads indicate dark shrunken neurons; red arrows indicate the Purkinje neurons. Scale bar, 50 μm. (F and G) Quantification of the number of Purkinje neurons in the cerebellum (F) and the number of normal neurons in the cortex (G). Data are presented as means ± SEM. [N = 3 mice per group, ***P = 0.0001 (F) and **P = 0.0033 (G), two-tailed t test]. (H and I) Western blotting against NeuN in the hippocampus (HIP) and against calbindin in the cerebellum (CB) from NOTCH2NLC-(GGC)17 and NOTCH2NLC-(GGC)98 mice at P50. Normalized relative expressions of NeuN and calbindin are present in (I). Data are presented as means ± SEM. (N = 3 mice per group, *P = 0.0434 and **P = 0.0038, two-tailed t test). (J and K) Immunofluorescence against GFAP and Iba1 in the HIP and CB from NOTCH2NLC-(GGC)17 and NOTCH2NLC-(GGC)98 mice at P50 (J). (K) Quantification of GFAP and Iba1 relative staining intensity. Data are presented as mean ± SEM. [N = 3 mice per group, ****P < 0.0001 (GFAP in HIP), **P = 0.0055 (GFAP in CB), **P = 0.0023 (Iba1 in HIP), and **P = 0.0048 (Iba1 in CB), two-tailed t test]. Green, GFAP; red, Iba1. Scale bar, 100 μm.

