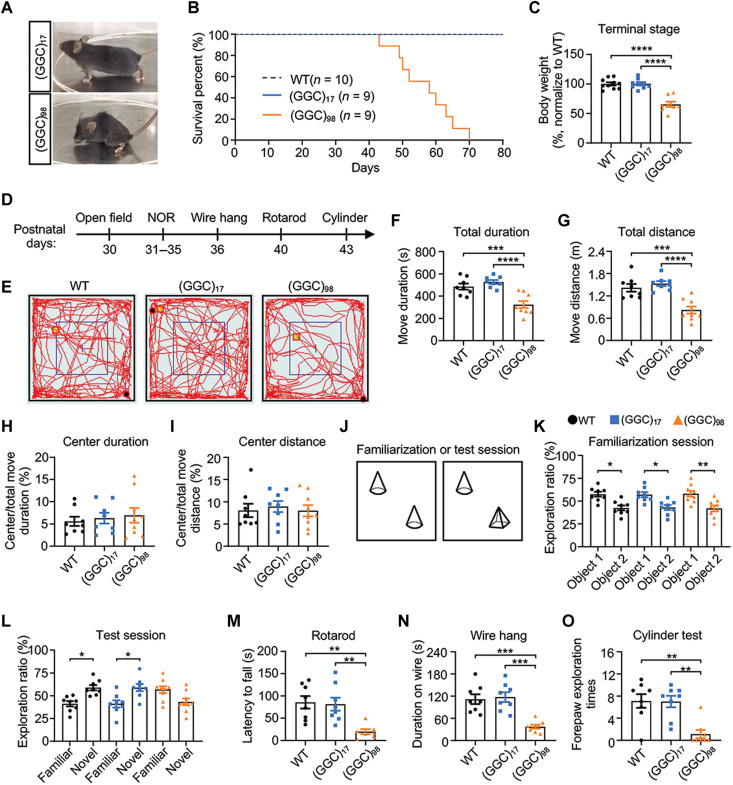
Fig. 5. NOTCH2NLC-(GGC)98 mice display behavioral phenotypes associated with NIID.
(A) Representative image of NOTCH2NLC mice at P50. (B) Kaplan-Meier survival curve of WT and NOTCH2NLC mice. (C) Comparison of body weight of WT and NOTCH2NLC mice at terminal stage. (D) Schematic diagram of the timeline for behavioral tests. NOR, novel object recognition test. All mice used in behavioral tests were male. (E to I) Open field test in WT and NOTCH2NLC mice. (E) Representative image of moving trajectory in the open field test. Total duration (F) and total distance (G), central duration (H), and central distance (I) were measured. (J to L) Novel object recognition test in WT and NOTCH2NLC mice. Schematic diagram of novel object recognition test (J); exploration ratio, which was calculated as the ratio of time spent exploring one object over time spent exploring both objects, in familiarization session (K) and test session (L). Data are presented as means ± SEM. (M to O) Motor-related behavioral tests, including rotarod (M), wire hang (N), and cylinder test (O) in WT, NOTCH2NLC-(GGC)17, and NOTCH2NLC-(GGC)98 mice. Data are presented as means ± SEM. [WT, N = 8; NOTCH2NLC-(GGC)17, N = 8; NOTCH2NLC-(GGC)98, N = 9, *P < 0.05, **P < 0.005, ***P < 0.0005, and ****P < 0.0001; one-way analysis of variance (ANOVA) test with multiple comparisons].

