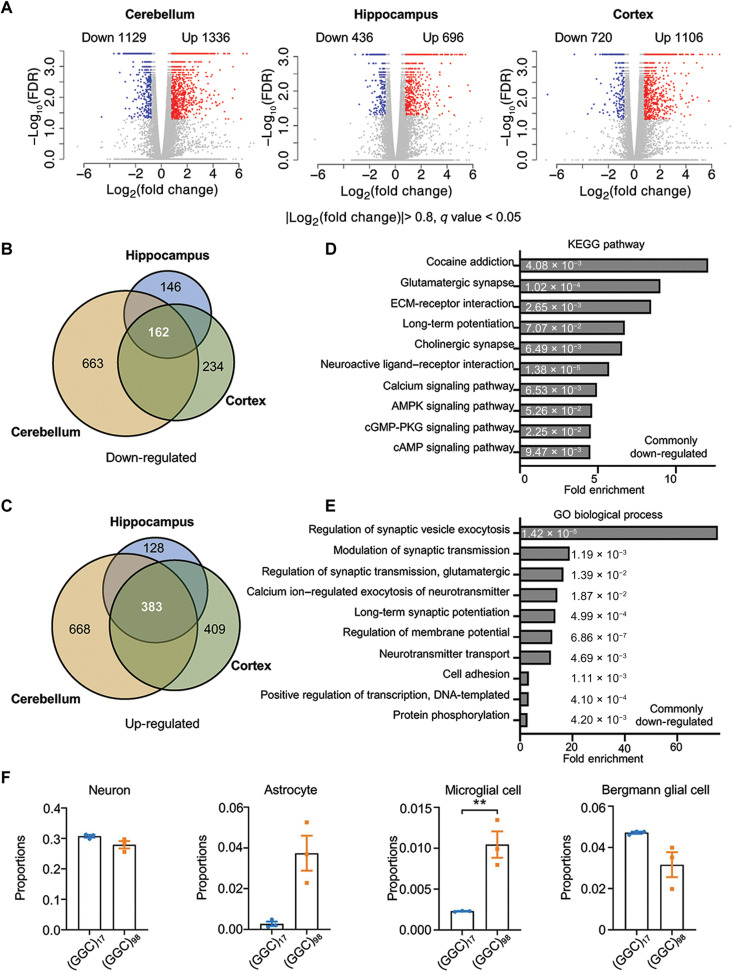
Fig. 6. Differential gene expression profiles in NOTCH2NLC-(GGC)98 mice.
(A) Shown are volcano plots of gene expression changes in the cerebellum, hippocampus, and prefrontal cortex of NOTCH2NLC-(GGC)98 mice compared to NOTCH2NLC-(GGC)17 mice. Colored dots indicate statistically significant DEGs [false discovery rate (FDR) < 0.05]. Blue dots are down-regulated genes [log2(fold change) < −0.8] and red dots are up-regulated genes [log2(foldChange) > 0.8]. Cuffdiff. N = 3 biological replicates per genotype per condition. (B and C) The numbers of down-regulated (B) and up-regulated (C) overlapping genes between the cerebellum, hippocampus, and cortex DEGs are shown in the Venn diagrams. (D and E) Kyoto Encyclopedia of Genes and Genomes (KEGG) pathway (D) and Gene Ontology (GO) biological process (E) enrichment analyses for the overlapping down-regulated DEGs identified from RNA-seq of NOTCH2NLC-(GGC)98 mice. The numbers on the bars are two-sided P values using Fisher’s exact. ECM, extracellular matrix; cGMP-PKG, cyclic guanosine 3’, 5’-monophosphate-dependent protein kinase G. (F) The cellular proportions of neurons, Bergmann glial cells, astrocytes, and microglial cells were estimated using MuSiC in the cerebellum samples from NOTCH2NLC-(GGC)98 mice and NOTCH2NLC-(GGC)17 mice. N = 3 mice per group, two-tailed t test, P = 0.1360 (neuron), P = 0.0540 (astrocyte), P = 0.0368 (microglia), and P = 0.1232 (Bergmann glia).

