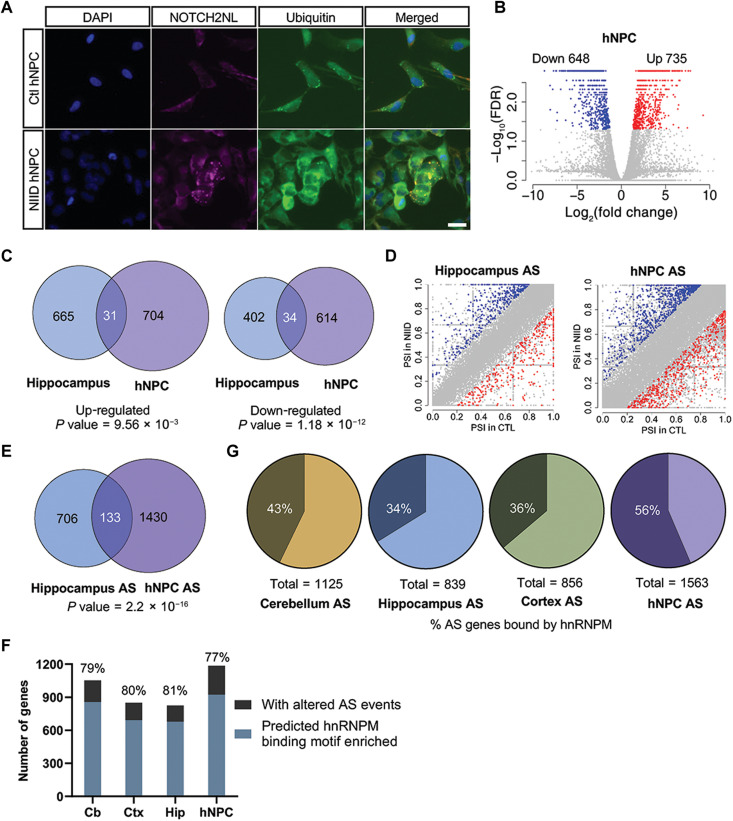
Fig. 7. Dysregulated AS is a common molecular alteration in both NOTCH2NLC-(GGC)98 mice and hNPCs.
(A) Immunostaining of NOTCH2NLC aggregates merged with ubiquitin in NIID and control hNPCs. Blue, DAPI; magenta, NOTCH2NL; green, ubiquitin. Scale bar, 10 μm. Each experiment was repeated at least three times independently. (B) Shown is a volcano plot of gene expression changes in NIID hNPCs compared to control hNPCs. Colored dots indicate statistically significant genes. Blue dots are down-regulated genes [log2(fold change) < −0.8] and red dots are up-regulated genes [log2(fold change) > 0.8] in NIID hNPCs compared to control hNPCs. Cuffdiff. N = 4 for NIID group; N = 3 for control group. (C) The overlaps of up-regulated and down-regulated DEGs between hNPCs and the hippocampus of NOTCH2NLC-(GGC)98 mouse are shown in the Venn diagrams (P value = 9.56 × 10−03 for up-regulated DEG overlaps and P value = 1.18 × 10⁻¹² for down-regulated DEG overlaps. The P value was obtained by chi-square test). (D) Shown are plots of differential AS events in hNPCs and the hippocampus of NOTCH2NLC-(GGC)98 mice compared to the corresponding controls. N = 4 for NIID group; N = 3 for control group. P value < 0.05, inclusion level difference > 0.2, rMATS. (E) The overlaps of differential AS events between hNPCs and the hippocampus of NOTCH2NLC-(GGC)98 mice are shown in the Venn diagram. (P value = 2.2 × 10⁻¹⁶. The P value was obtained by chi-square test). (F) The prediction of hnRNPM binding on SE events was performed using RBPmap with high stringency. (G) The proportions of differential AS events of each sample [the cerebellum, hippocampus, or cortex of NOTCH2NLC-(GGC)98 mice and hNPCs] bound by hnRNPM are shown in the pie charts.

