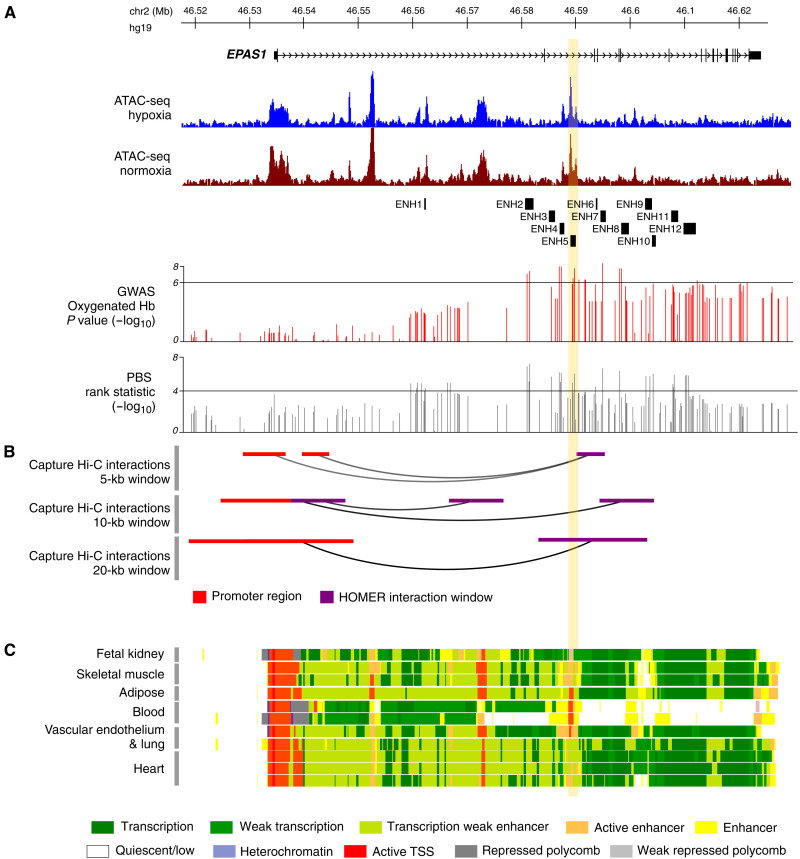
Fig. 1. Regulatory landscape of EPAS1.
The EPAS1 promoter interacts with a region of open chromatin in HAECs, which spans the segment of colocalized association and selection signals and the enhancer elements active in multiple tissues. (A) The genomic structure of the EPAS1 gene and ATAC-seq peaks in hypoxia (blue) and normoxia (brown). Also shown is the position of all enhancer (ENH) regions tested in luciferase reporter assays. Below, two tracks show, respectively, the −log10 P value for the GWAS of oxyHb and the −log10 PBS rank statistic of all SNPs tested in EPAS1 by Jeong et al. (17). The horizontal bar in each indicates the cutoff used for defining candidate SNPs (table S2). (B) Results of the promoter capture Hi-C HOMER analysis showing all regions within the gene that interact with the EPAS1 promoter ascertained in three window sizes. (C) Chromatin state tracks from the NIH Roadmap Epigenomics Mapping Consortium. The vertical yellow bar indicates the position of ENH5.

