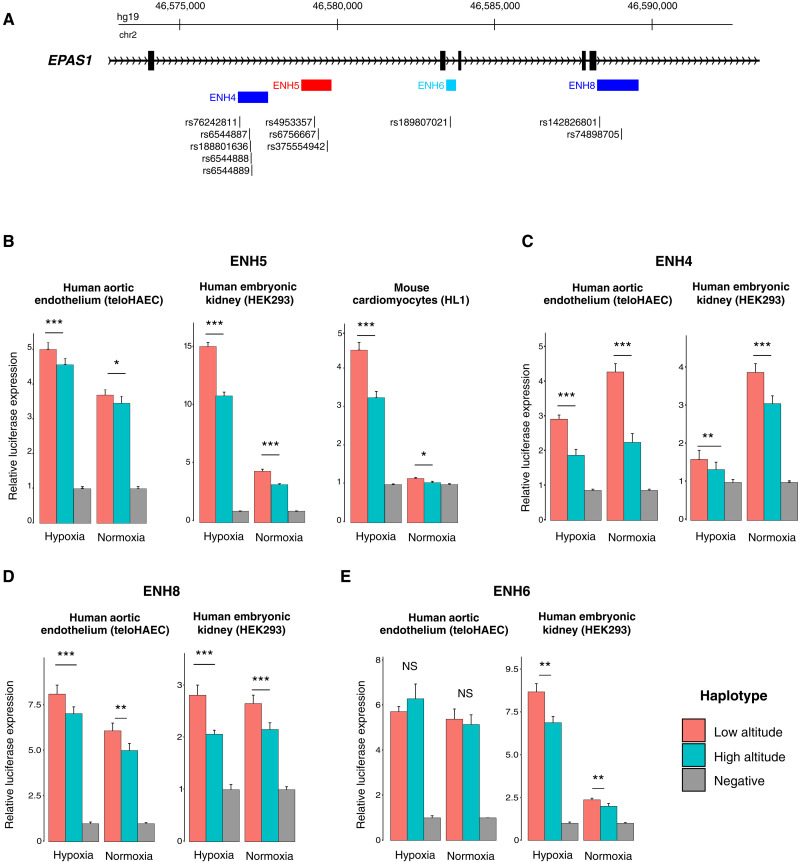
Fig. 2. EPAS1 enhancers with allele-specific activity.
Four genomic segments spanning candidate SNPs show significant differences in enhancer activity across high- and low-altitude alleles. (A) The locations of the four enhancer regions with allele-specific activity are shown for each enhancer along with the positions of the candidate SNPs within each construct. Enhancers are color-coded depending on the cell types in which significant allelic effects (P < 0.05) were observed: red for effects shared across kidney, endothelium, and cardiomyocytes; blue for kidney and endothelium; and cyan for kidney only. (B) Luciferase reporter assay results for ENH5 in endothelium, kidney, and cardiomyocytes. Results are for a minimum of two independent construct DNA preparations each with at least three independent transfection replicates in each condition and are depicted as mean relative expression + SEM. (C to E) Luciferase reporter assay results for ENH4 (C), ENH8 (D), and ENH6 (E). Relative expression data for each replicate can be found in table S3. Probability values for all paired t tests performed can be found in table S4. *P < 0.05, **P < 0.01, and ***P < 0.005. NS, not significant.

