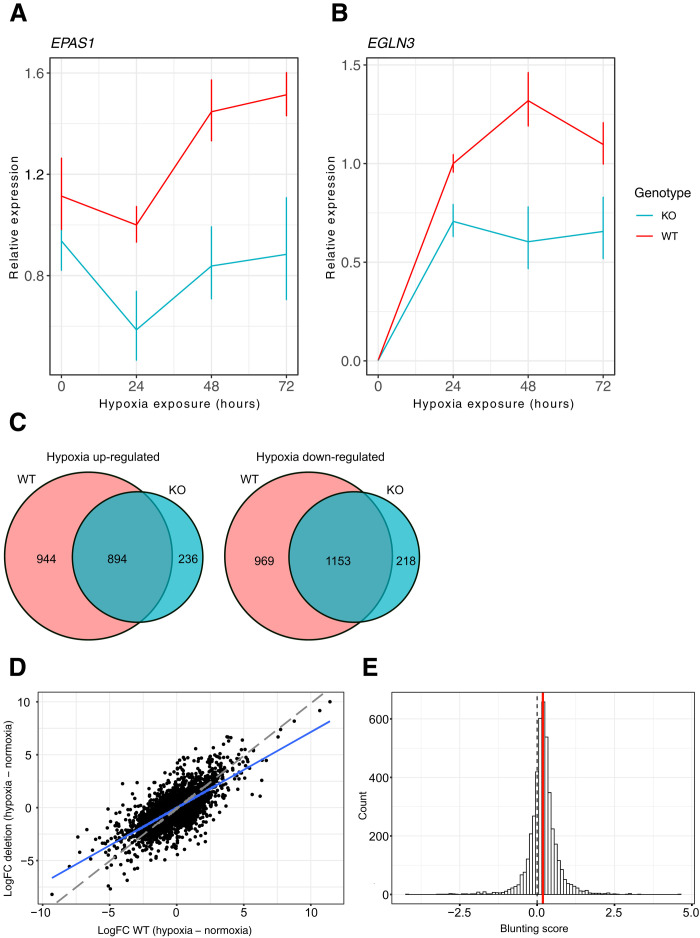
Fig. 3. Deletion of ENH5 in endothelial cells results in dampening of transcriptional responses to acute and sustained hypoxia.
(A) EPAS1 and (B) EGLN3 transcript levels detected by quantitative polymerase chain reaction (qPCR) in the endothelial ENH5 KO and WT clones over 72 hours in hypoxia (1% O2). Mean relative expression of three homozygous KO and three homozygous WT clones is shown with red and blue lines, respectively. Error bars reflect the SEM. (C) Venn diagrams showing overlap of up- or -down-regulated genes in WT and KO clones after sustained hypoxia. Most differentially expressed genes in the KO are also differentially expressed in the WT. (D) Scatterplot showing the transcriptional response (logFC) to sustained hypoxia (14 days, 1% O2) in three ENH5 KO clones relative to that in three WT clones. The blue line shows the linear regression line of deletion log fold change (LFC) predicted by the WT LFC response (LFC_KO ~ LFC_WT + 0). The red dashed line represents a slope of 1. (E) Histogram of the distribution of blunting scores for differentially expressed genes in response to sustained hypoxia (46) showing an overall shift toward weaker response in ENH5 KO relative to WT clones (positive blunting score represents more extreme transcriptional changes in response to hypoxia in the WT relative to the KO). The dashed line marks a blunting score of 0 expected under the null hypothesis of no difference in transcriptional response across genotypes, while the green line depicts the observed mean score (0.185). Scores were tested in a two-sided, one-sample Student’s t test (HA: μ ≠ 0) with a P < 2.2 × 10⁻¹⁶.

