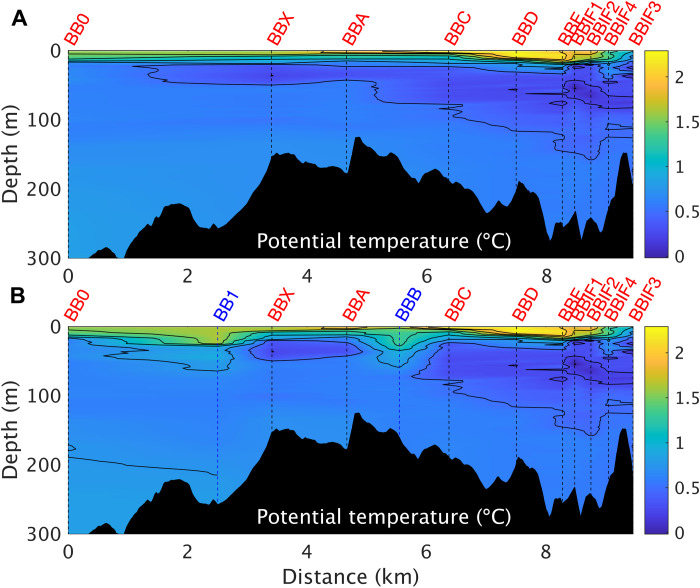
Fig. 4. Vertical temperature structure of the ocean before and after the calving event.
(A) Potential temperature across Börgen Bay using only precalving stations marked in red in Fig. 1B. William Glacier is on the right. (B) As per (A) but including also the postcalving stations (BB1 and BBB) labeled in blue.

