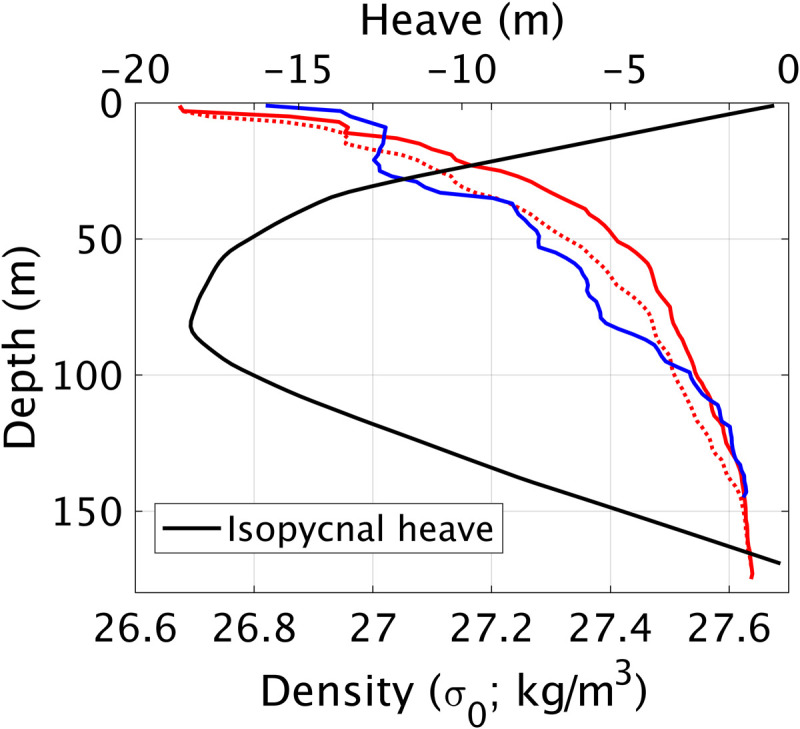
Fig. 5. Density profiles before (BBA; red) and after (BBB; blue) the calving event.

Solid line is original data, and dashed line is with data adjusted to conserve mass before and after the calving and to account for spatial separation of casts. Black is the amount of heave adjustment applied (see Materials and Methods).
