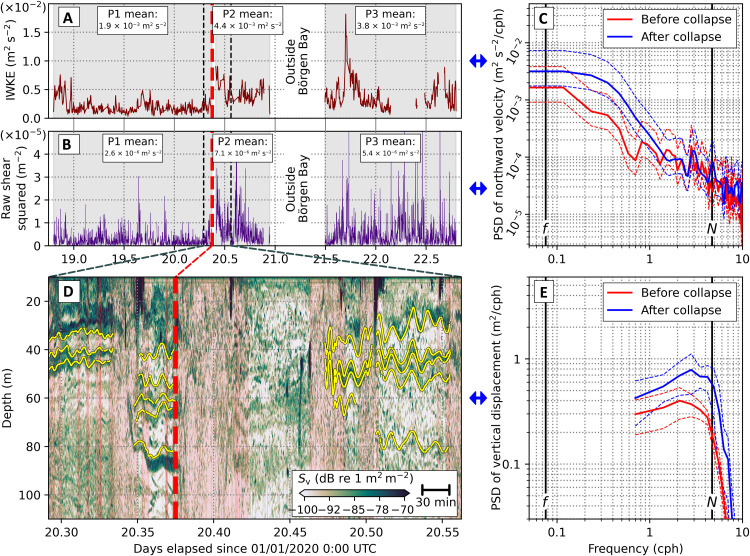
Fig. 6. Acoustic tracking of internal tsunamis and their characteristics.
(A) Internal wave kinetic energy (IWKE) for depths shallower than 135 m. Legend shows IWKE values averaged for three periods, specifically before the ice collapse (days 18.80 to 20.39), immediately after (days 20.40 to 20.95), and a third period after the ship had departed and then returned to Börgen Bay (days 21.41 to 22.79). (B) Shear-squared, calculated between 75 and 25 m depth. Note the strong increase at the time of the calving event (vertical dashed bar) and persistent elevated values thereafter. (C) Power spectral density (PSD) of the velocity data between 50 and 100 m depth, with uncertainty bands. (D) EK80 echogram for the period immediately spanning the glacier calving event. Vertical displacements of internal surfaces are traced (yellow; see Materials and Methods). (E) Power spectral density (PSD) of EK80-derived internal surface displacements with uncertainty bands. Frequencies <0.7 cycles per hour (cph) are not visible in the spectra because of the limited presence of clear and continuous scattering layers in the echograms.

