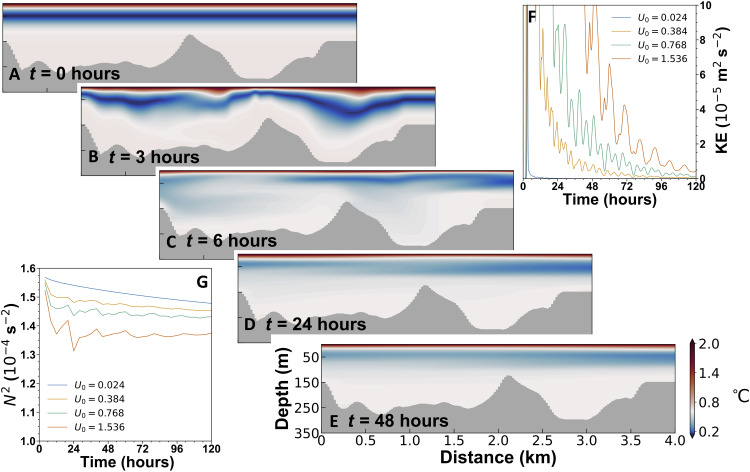
Fig. 7. 2D model simulations of internal tsunami propagation, breaking, and mixing.
(A to E) Potential temperature at the time intervals stated, with internal wave introduced on the right side of the panels. The peak inflow for the imposed wave is U0 = 1.536 m s−1, and the total energy introduced is ~500 J m−3. The incoming wave peaks at 3 hours and by 6 hours are effectively zero. Note the nonlinear color scale, emphasizing where most of the mixing occurs. (F) Domain-average kinetic energy for four different strengths. (G) Four-hour averages of squared buoyancy frequency, averaged over the top 60 m.

