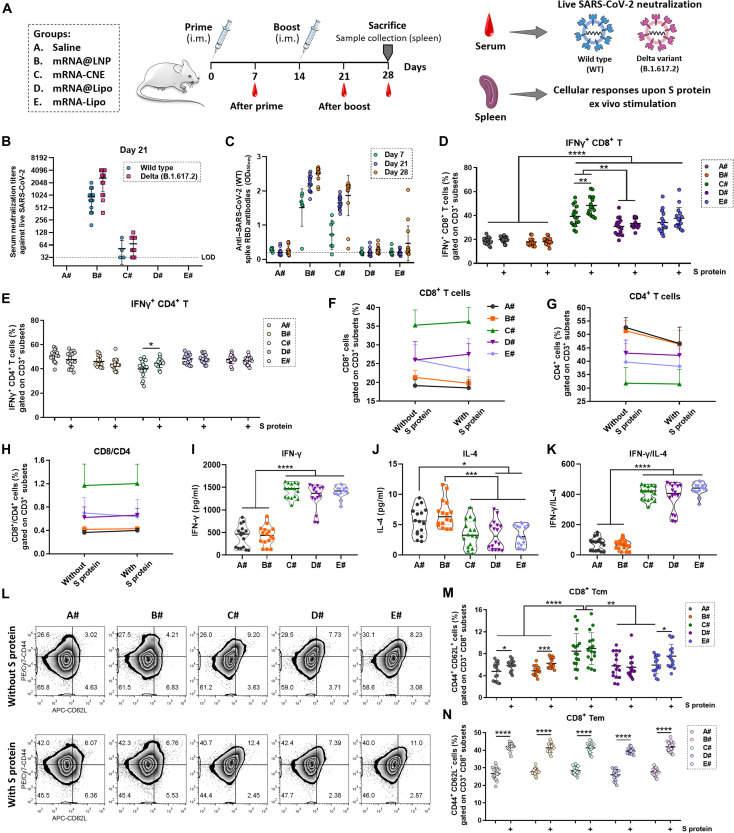
Fig. 3. Anti–SARS-CoV-2 humoral and cellular immunity induced by different mRNA nanoparticles.
(A) Schematic outline of the experimental protocol. (B) On day 7 (after prime) and day 21 (after boost), sera from vaccinated mice were collected, serially diluted, and assayed for neutralization activities against infectious live SARS-CoV-2 [both wild type (WT) and mutant Delta, n = 15]. LOD, below the limit of detection. (C) On days 7 (n = 7), 21 (n = 15), and 28 (n = 15), serum anti–SARS-CoV-2 (2019-nCoV) spike RBD IgG antibodies were assayed using an ELISA kit. OD450nm, optical density at 450 nm. (D and E) Flow cytometric analysis of the frequency of IFN-γ+ CD8+ T cells (D) and IFN-γ+ CD4+ T cells (E) in splenic lymphocytes ex vivo stimulated with or without S protein (n = 16). (F to H) Changes in the frequency of CD8+ T cells (F), CD4+ T cells (G), and CD8/CD4 T cells (H) in splenic lymphocytes upon S protein stimulation (n = 16). (I to K) Determination of IFN-γ (I) and IL-4 (J) in the culture supernatant of S protein–activated splenic lymphocytes using cytokine kits (n = 16). The secretion of IFN-γ was divided by that of IL-4 (K) to investigate the T helper type 1 (TH1)–biased immunity. (L to N) Representative flow cytometric pictures (L) and summary plot (M and N) of data showing the frequency of CD8+ Tcm (CD44+ CD62L+ CD8+ T cells) and CD8+ Tem (CD44+ CD62L− CD8+ cells) in splenic lymphocytes stimulated with or without S protein in vitro (n = 16). All error bars are expressed as ±SD. Significant at *P < 0.05; **P < 0.01; ***P < 0.001; ****P < 0.0001.

