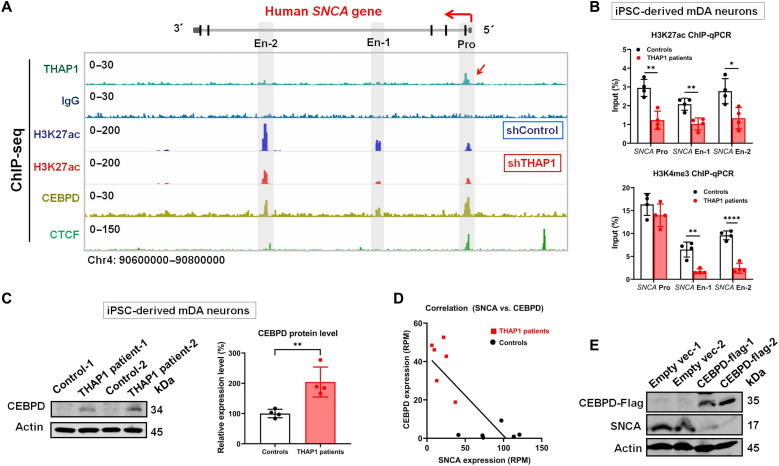
Fig. 2. Characterization of the mechanisms by which THAP1 regulates SNCA expression.
(A) THAP1 ChIP-seq detects its binding signal on the SNCA promoter (red arrow), which is not seen in IgG control (lanes 1 and 2). H3K27ac ChIP-seq defines the SNCA promoter and potential enhancers in SH-SY5Y cells and also shows its modification on the SNCA gene in control (shControl) and THAP1 knockdown (shTHAP1) SH-SY5Y cells (En-1: Chr4: 90720577–90722136; En-2: Chr4: 90673800–90675200) (lanes 3 and 4). CEBPD and CTCF ChIP-seq shows their binding sites on both the SNCA promoter and enhancers (lanes 5 and 6). (B) ChIP-qPCR analyzes their H3K27ac and H3K4me3 modifications on the SNCA promoter and enhancers in THAP1 patients’ iPSC-Neurons and in control iPSC-Neurons. (C) Western blot analysis shows the endogenous CEBPD protein level in THAP1 patients’ iPSC-Neurons and in control iPSC-Neurons. (D) Correlation analysis reveals that the CEPBD mRNA level is negatively correlated to the SNCA mRNA level in iPSC-Neurons [reads per million (RPM)] (equation: Y = −0.4196 * X + 43.28; P = 0.0014). (E) Western blotting determines the expression of CEBPD and SNCA in CEBPD-overexpressing SH-SY5Y cells. *P < 0.05; **P < 0.01; ****P < 0.0001. Comparison by unpaired two-tailed t test.

