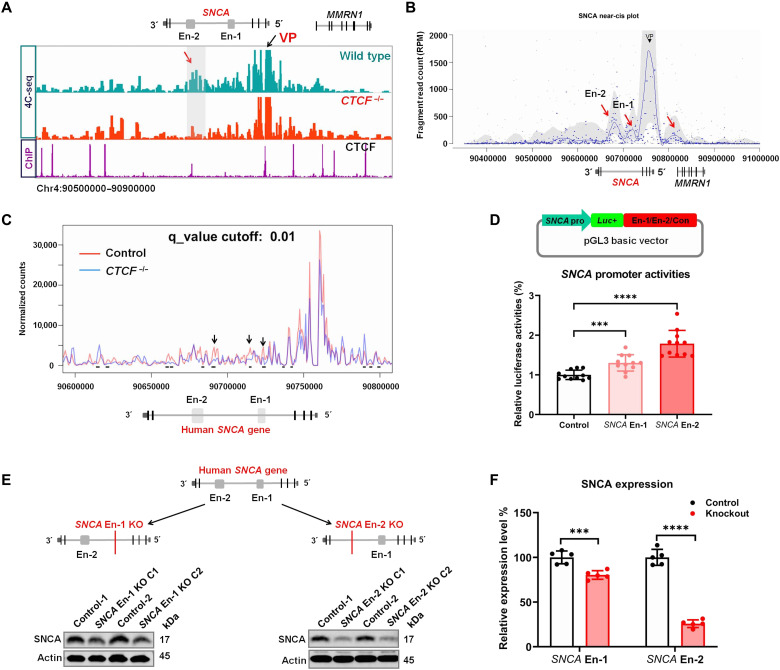
Fig. 4. SNCA intronic enhancers regulate its expression.
(A) Distribution of SNCA 4C-seq raw reads in wild-type and CTCF−/− SH-SY5Y cells (lanes 1 and 2). CTCF ChIP-seq detects its binding sites around the SNCA gene (lane 3). The SNCA promoter region was set as VP. The red arrow indicates the SNCA En-2 region that is strongly in contact with the VP in wild-type cells, while this interaction disappeared in CTCF−/− SH-SY5Y cells (En-1 and En-2 indicate the position of the two SNCA intronic enhancers, respectively). (B) The Basic4C package was used to analyze the 4C-seq data. Red arrows indicate the regions that are in contact with the VP (SNCA promoter) (from left to right: SNCA En-2, SNCA En-1, and MMRN1 promoter). (C) The 4C-ker package analyzes the change of interactions between the SNCA promoter and its intron 4 region (including its two enhancers) in wild-type and CTCF knockout (CTCF−/−) SH-SY5Y cells (at least two biological replicates of each sample were performed). Black arrows and short black lines both show the regions with statistically changed interactions with the SNCA promoter (4C-ker analysis default setting: K = 10, q_value = 0.01). (D) Schematic diagram shows the strategies of cloning vectors to characterize the role of SNCA enhancers (En-1 and En-2) in regulating its promoter (SNCA pro) activities. A genomic unrelated region was used as a negative control (Con) (top). Luciferase reporter assay analysis determines the role of SNCA enhancers in regulating its promoter activities (bottom). (E) Schematic graphs present the strategies using the CRISPR-Cas9 technique to knock out SCNA En-1 or En-2 in SH-SY5Y cells (top). Western blotting (bottom) shows the SNCA protein level in En-1 or En-2 knockout SH-SY5Y cells. (F) Statistical analysis shows the SNCA protein level in SNCA En-1 or En-2 knockout SH-SY5Y cells. ***P < 0.001; ****P < 0.0001. Comparison by unpaired two-tailed t test.

