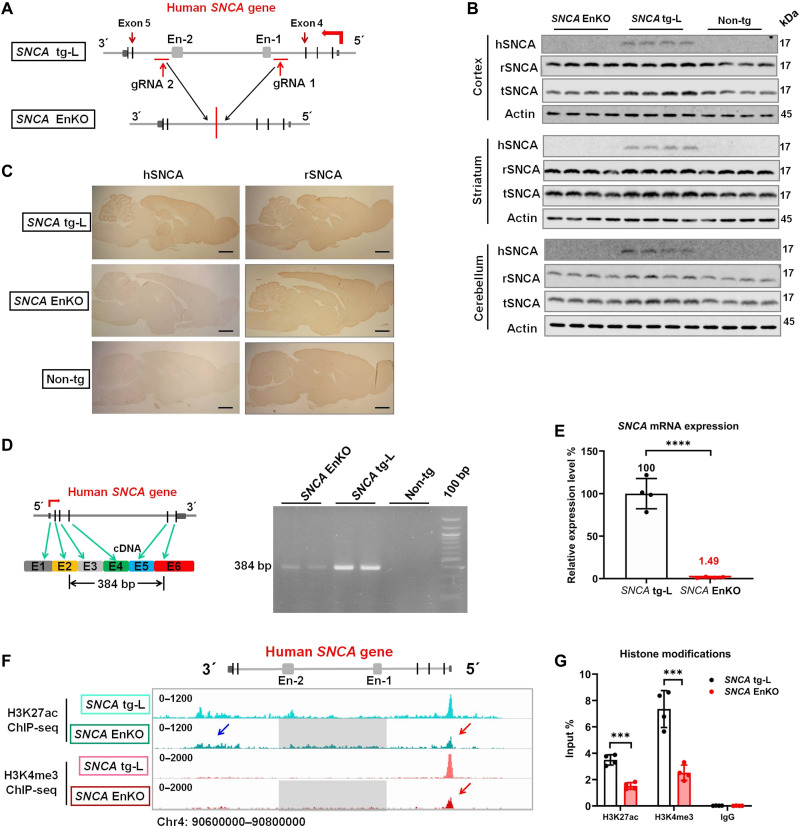
Fig. 6. The human SNCA intronic enhancer clusters predominantly control its expression in brain.
(A) Schematic graph shows the position of gRNAs and the human SNCA gene structure in SNCA tg-L and SNCA EnKO rats. (B) Western blotting confirms the expression of hSNCA, rSNCA, and tSNCA in different brain regions of SNCA EnKO, SNCA tg-L, and Non-tg rats (n = 5 rats in each group). (C) Immunohistochemical staining of hSNCA and rSNCA in the brain of SNCA tg-L, SNCA EnKO, and Non-tg rats (n = 3 rats in each group). Scale bars, 2 mm. (D) Schematic representation of the primers used to amplify full-length human SNCA mRNA (384 bp in length) (left). RT-PCR determines the expression of full-length human SNCA mRNA in SNCA EnKO, SNCA tg-L, and Non-tg rats (right) (n = 3 rats in each group). (E) RT-qPCR determines the expression level of human SNCA mRNA in SNCA EnKO rats. SNCA tg-L rats were used as a control (n = 4 rats in each group). (F) H3K27ac and H3K4me3 ChIP-seq reveals the status of histone modifications of the human SNCA gene in SNCA tg-L and SNCA EnKO rats (blue arrow: H3K27ac modification downstream of the human SNCA gene in SNCA EnKO rat; red arrow: H3K27ac and H3K4me3 modification on the promoter of the human SNCA gene in SNCA EnKO rat; gray squares indicate the region that was deleted from the human SNCA gene in SNCA EnKO rat). (G) ChIP-qPCR quantitatively determines the histone modifications on the SNCA promoter in SNCA tg-L and SNCA EnKO rats (n = 4 rats in each group). ***P < 0.001; ****P < 0.0001. Comparison by unpaired two-tailed t test.

