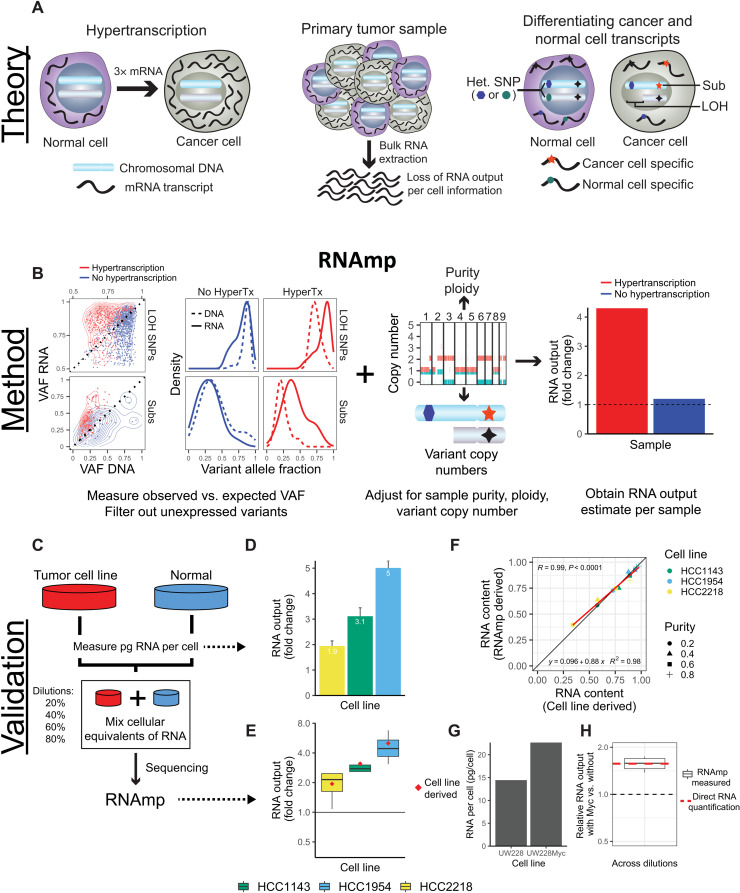
Fig. 1. Overview of RNA output analysis with RNAmp.
(A) Hypertranscription occurs when cancer cells elevate their RNA output above normal cell levels (left). Upon RNA extraction from primary tumor tissue, RNA output per cell information is lost (middle). Cancer cell– and normal cell–specific transcripts can be identified using tumor-specific marker variants, such as somatic substitutions (Subs) and LOH-SNPs (right). (B) DNA and RNA VAF distributions in samples with and without hypertranscription (HyperTX). Positive shifts in the RNA VAF of tumor-specific variants indicate that RNA output has increased. To estimate the overall fold change in RNA output of cancer versus normal cells, RNAmp incorporates these VAF shifts with tumor purity, ploidy, and local copy number data. (C) Cell number–normalized RNA-seq was performed on tumor and normal cell mixtures to validate RNAmp’s accuracy. RNA output per cell was measured before cell mixing. These mixtures were then sequenced and processed by RNAmp. (D) Fold change in RNA output levels of cancer cell lines measured by direct RNA quantification. Error bars correspond to SD. (E) RNAmp-derived RNA output measures (boxplots) compared to direct RNA quantification measures (red diamonds). Boxplot center line corresponds to the median, box limits are upper and lower quartiles, and whiskers represent 1.5 × interquartile range. (F) Pearson correlation of RNAmp-derived tumor RNA content estimates compared to direct RNA content quantification (R = 0.99, P < 0.0001). (G) RNA output per cell measured in medulloblastoma cells with and without MYC induction. (H) RNAmp-derived fold change in RNA output between UW228 Myc and UW228 wild-type cells (boxplot) compared to direct RNA quantification (red line). Boxplots are defined in (E).

