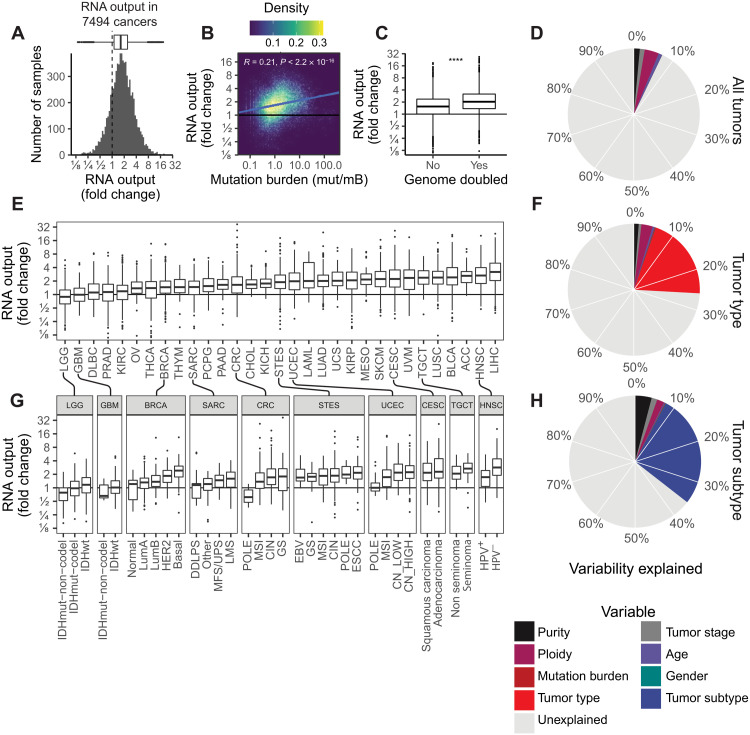
Fig. 2. The landscape of hypertranscription in primary human cancer.
(A) Histogram showing RNA output, expressed as a fold change, across 7494 primary tumor samples. Dashed line indicates onefold, meaning no change in RNA output level. (B) Pearson correlation between RNA output and TMB (P < 0.0001, R = 0.21). (C) Boxplot of RNA output levels in genome-doubled tumors versus nondoubled tumors (****P < 0.0001, Student’s two-sided t test). (D) Pie chart depicting the proportion of variability in RNA output that is explained by clinical features (purity, ploidy, tumor stage, age, mutation burden, and gender). The overall variability (7.1%) is explained by these features. (E) Boxplots of RNA output levels in tumor types. (F) Pie chart depicting the proportion of variability in RNA output explained including tumor type information. Nineteen percent more variance is explained by this model, for a total of 26%. (G) RNA output levels in tumor subtypes. (H) Pie chart depicting the proportion of variability in RNA output explained including tumor-type information. Nine percent more variance is explained by this model, for a total of 35%. Boxplots are defined in Fig. 1E. ESCC, esophageal squamous cell carcinoma; GS, genomically stable; LMS, leiomyosarcoma; SKCM, skin cutaneous melanoma; KIRC, kidney renal clear cell carcinoma; OV, ovarian; PAAD, pancreatic adenocarcinoma; CHOL, cholangiocarcinoma; UCS, uterine carcinosarcoma; KIRP, kidney renal papillary cell carcinoma; CESC, cervical squamous cell carcinoma and endocervical adenocarcinoma; UVM, uveal melanoma; LIHC, liver hepatocellular carcinoma. Tumor-type abbreviations can be found in table S1.

